The impact of sampling time on peak capacity and analysis speed in on-line comprehensive two-dimensional liquid chromatography
- PMID: 20673902
- PMCID: PMC2933795
- DOI: 10.1016/j.chroma.2010.07.009
The impact of sampling time on peak capacity and analysis speed in on-line comprehensive two-dimensional liquid chromatography
Abstract
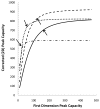
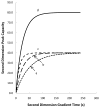
Comprehensive two-dimensional liquid chromatography (2DLC) offers a number of practical advantages over optimized one-dimensional LC in peak capacity and thus in resolving power. The traditional "product rule" for overall peak capacity for a 2DLC system significantly overestimates peak capacity because it neglects under-sampling of the first dimension separation. Here we expand on previous work by more closely examining the effects of the first dimension peak capacity and gradient time, and the second dimension cycle times on the overall peak capacity of the 2DLC system. We also examine the effects of re-equilibration time on under-sampling as measured by the under-sampling factor and the influence of molecular type (peptide vs. small molecule) on peak capacity. We show that in fast 2D separations (less than 1h), the second dimension is more important than the first dimension in determining overall peak capacity and conclude that extreme measures to enhance the first dimension peak capacity are usually unwarranted. We also examine the influence of sample types (small molecules vs. peptides) on second dimension peak capacity and peak capacity production rates, and how the sample type influences optimum second dimension gradient and re-equilibration times.
2010 Elsevier B.V. All rights reserved.
Figures


Similar articles
-
Equation for peak capacity estimation in two-dimensional liquid chromatography.Anal Chem. 2009 Jan 15;81(2):845-50. doi: 10.1021/ac801772u. Anal Chem. 2009. PMID: 19053226 Free PMC article.
-
Fast, comprehensive two-dimensional liquid chromatography.J Chromatogr A. 2007 Oct 19;1168(1-2):3-43; discussion 2. doi: 10.1016/j.chroma.2007.08.054. Epub 2007 Aug 30. J Chromatogr A. 2007. PMID: 17888443 Free PMC article. Review.
-
Optimizing the peak capacity per unit time in one-dimensional and off-line two-dimensional liquid chromatography for the separation of complex peptide samples.J Chromatogr A. 2009 Oct 30;1216(44):7368-74. doi: 10.1016/j.chroma.2009.02.075. Epub 2009 Mar 5. J Chromatogr A. 2009. PMID: 19285679
-
High resolution two-dimensional liquid chromatography coupled with mass spectrometry for robust and sensitive characterization of therapeutic antibodies at the peptide level.J Chromatogr B Analyt Technol Biomed Life Sci. 2019 Dec 15;1134-1135:121832. doi: 10.1016/j.jchromb.2019.121832. Epub 2019 Nov 12. J Chromatogr B Analyt Technol Biomed Life Sci. 2019. PMID: 31790917
-
A review of two-dimensional liquid chromatography approaches using parallel column arrays in the second dimension.Anal Chim Acta. 2022 Oct 2;1228:340300. doi: 10.1016/j.aca.2022.340300. Epub 2022 Aug 26. Anal Chim Acta. 2022. PMID: 36127000 Review.
Cited by
-
Optimization for speed and sensitivity in capillary high performance liquid chromatography. The importance of column diameter in online monitoring of serotonin by microdialysis.J Chromatogr A. 2012 Aug 17;1251:54-62. doi: 10.1016/j.chroma.2012.06.002. Epub 2012 Jun 9. J Chromatogr A. 2012. PMID: 22771067 Free PMC article.
-
Micro free flow electrophoresis.Lab Chip. 2017 Dec 19;18(1):27-40. doi: 10.1039/c7lc01105a. Lab Chip. 2017. PMID: 29077103 Free PMC article. Review.
-
Reducing Dilution and Analysis Time in Online Comprehensive Two-Dimensional Liquid Chromatography by Active Modulation.Anal Chem. 2016 Feb 2;88(3):1785-93. doi: 10.1021/acs.analchem.5b04051. Epub 2016 Jan 8. Anal Chem. 2016. PMID: 26709410 Free PMC article.
-
Improving peak capacity in fast online comprehensive two-dimensional liquid chromatography with post-first-dimension flow splitting.Anal Chem. 2011 Dec 15;83(24):9531-9. doi: 10.1021/ac202317m. Epub 2011 Nov 23. Anal Chem. 2011. PMID: 22017622 Free PMC article.
-
Peak capacity optimization in comprehensive two dimensional liquid chromatography: a practical approach.J Chromatogr A. 2011 Jan 7;1218(1):64-73. doi: 10.1016/j.chroma.2010.10.096. Epub 2010 Oct 31. J Chromatogr A. 2011. PMID: 21145554 Free PMC article.
References
-
- Schure MR, Cohen SA, editors. Multidimensional Liquid Chromatography: Theory, Instrumentation and Applications. Wiley & Sons; New York: 2008.
-
- Issaq HJ, Chan KC, Janini GM, Conrads TP, Veenstra TD. J Chromatogr B. 2005;817:35. - PubMed
-
- Dunn WB, Ellis DI. Trends Anal Chem. 2005;24:285.
-
- Karger BL, Snyder LR, Horvath C. An Introduction to Separation Science. Wiley & Sons; New York: 1973.
Publication types
MeSH terms
Substances
Grants and funding
LinkOut - more resources
Full Text Sources
Other Literature Sources

