. 2010 Nov;31(31):7971-7.
doi: 10.1016/j.biomaterials.2010.07.028. Epub 2010 Jul 31.

Porous nanofibrous PLLA scaffolds for vascular tissue engineering

Affiliations

Porous nanofibrous PLLA scaffolds for vascular tissue engineering

Jiang Hu et al. Biomaterials. 2010 Nov.

Abstract

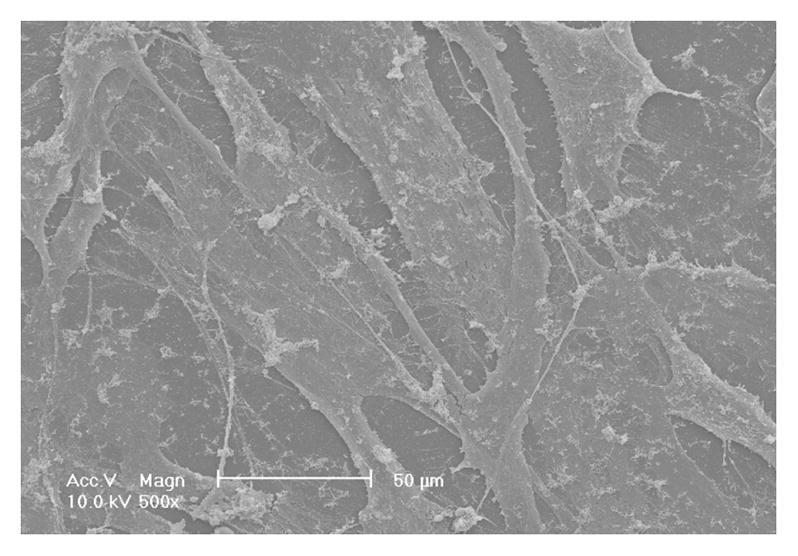
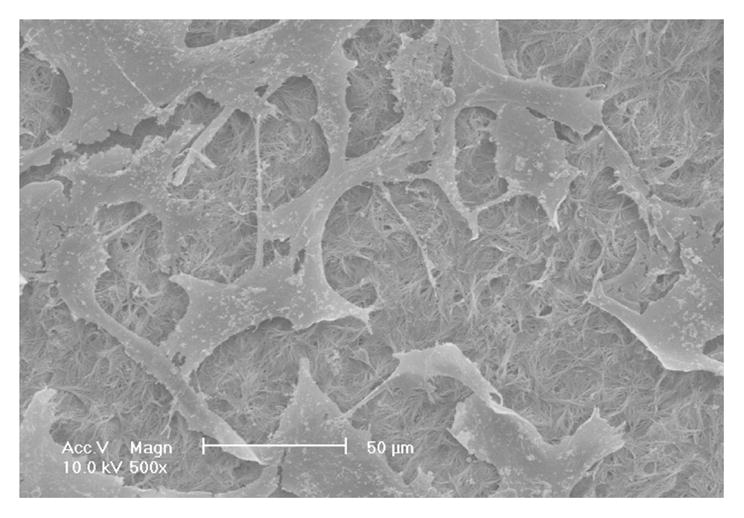
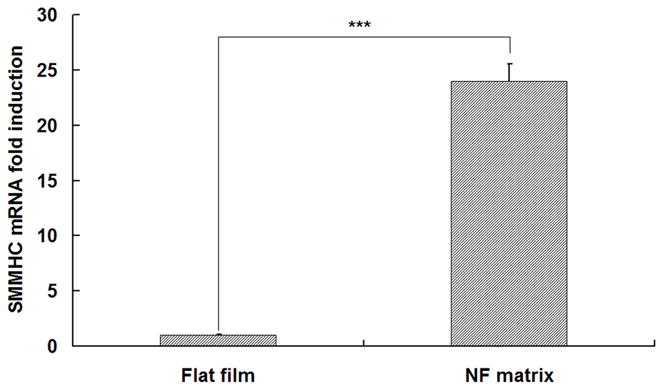
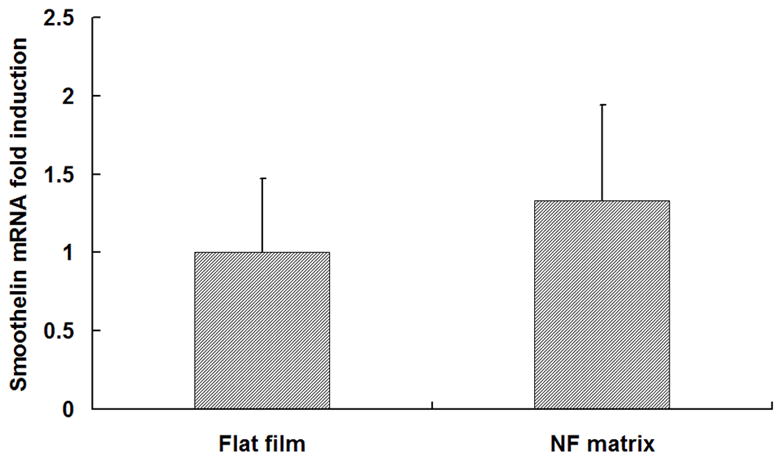
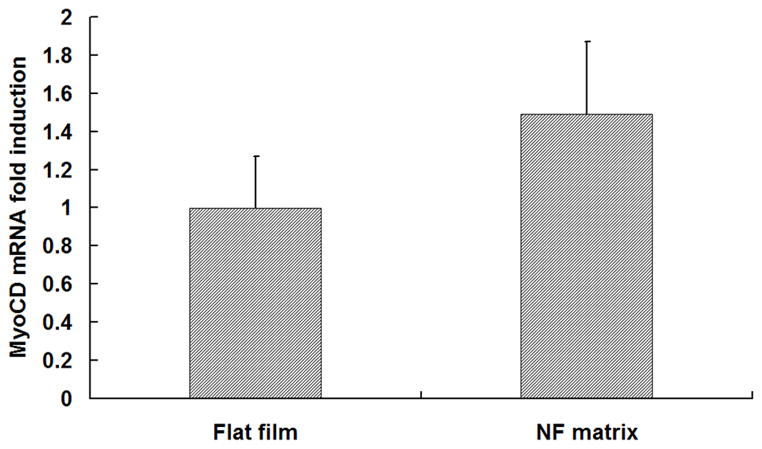
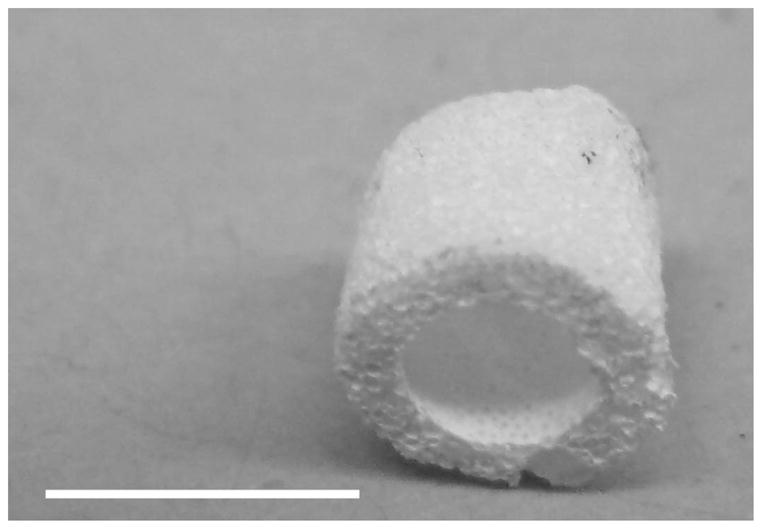
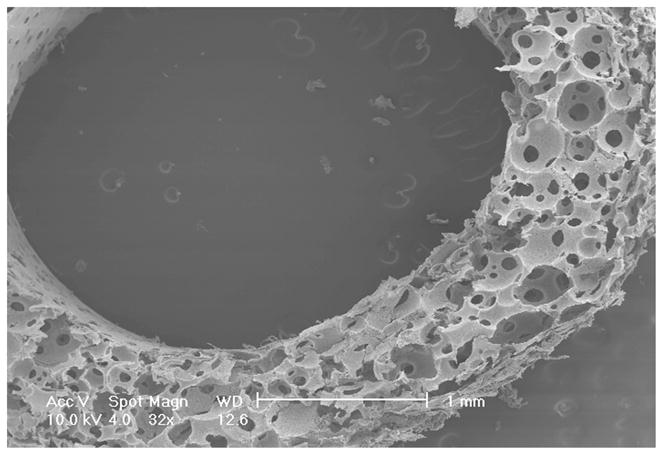
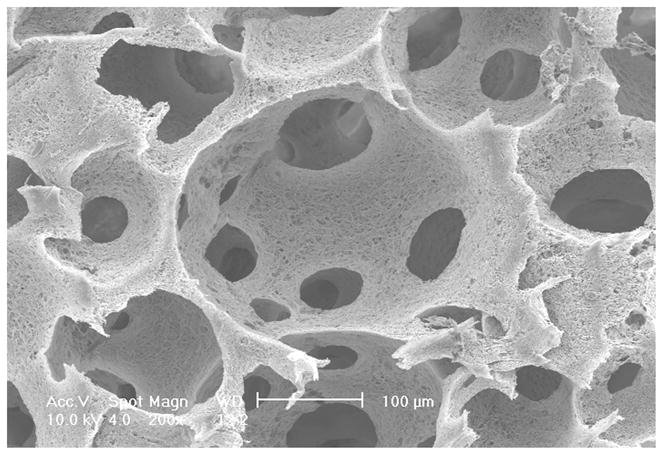
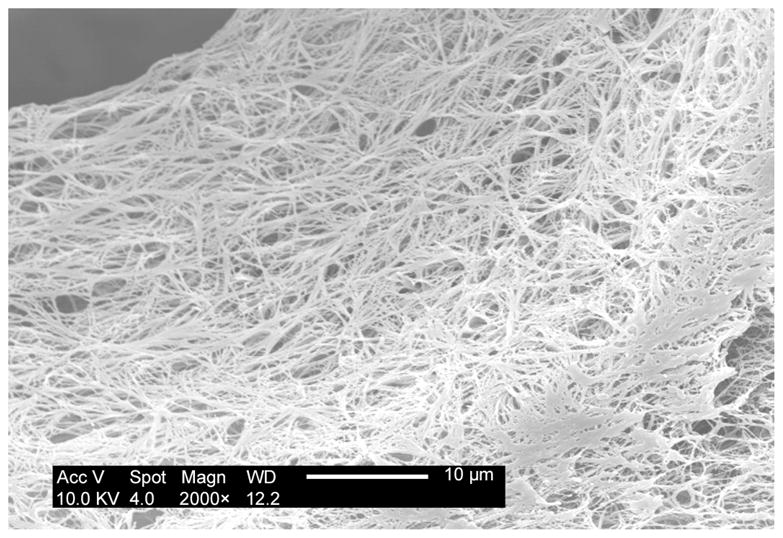
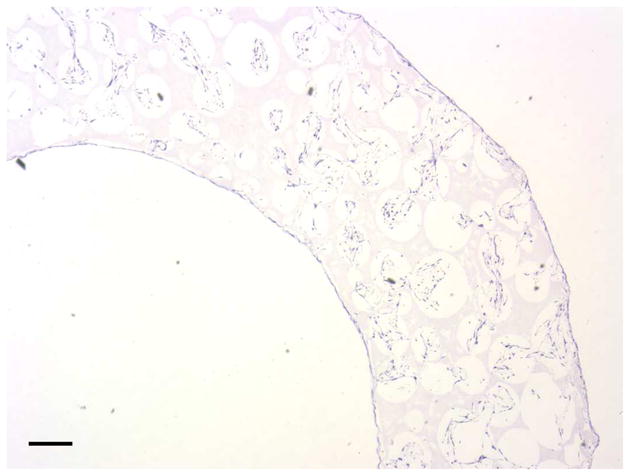
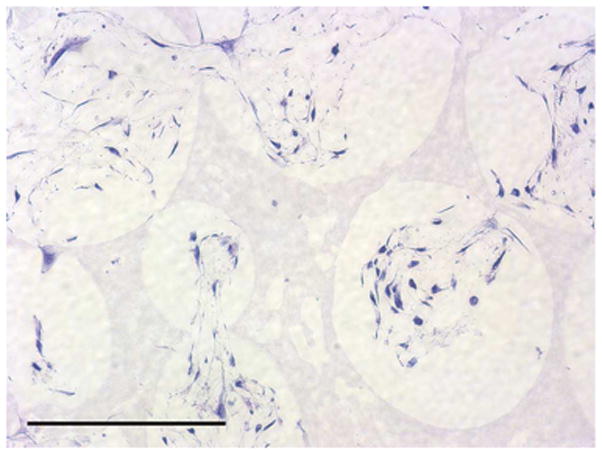
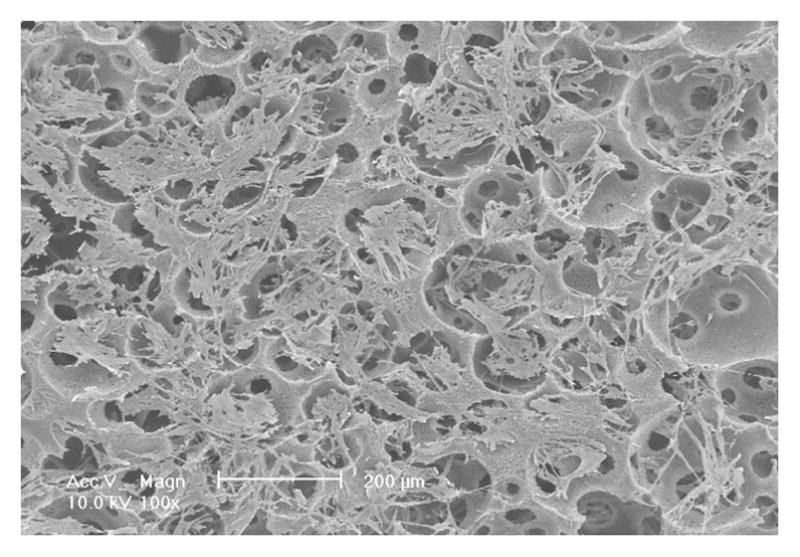
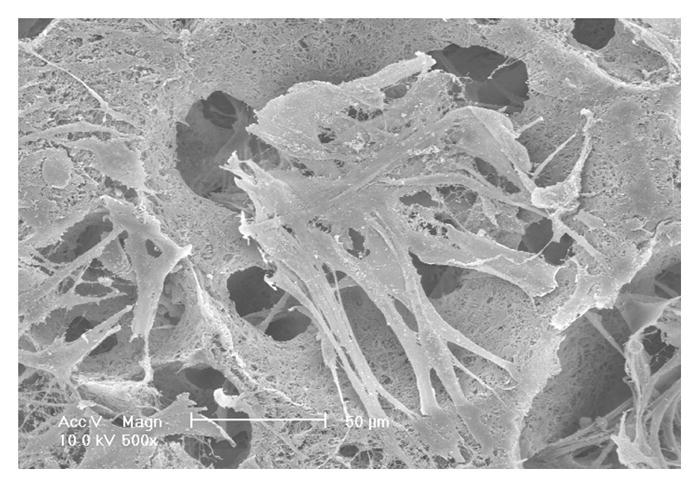
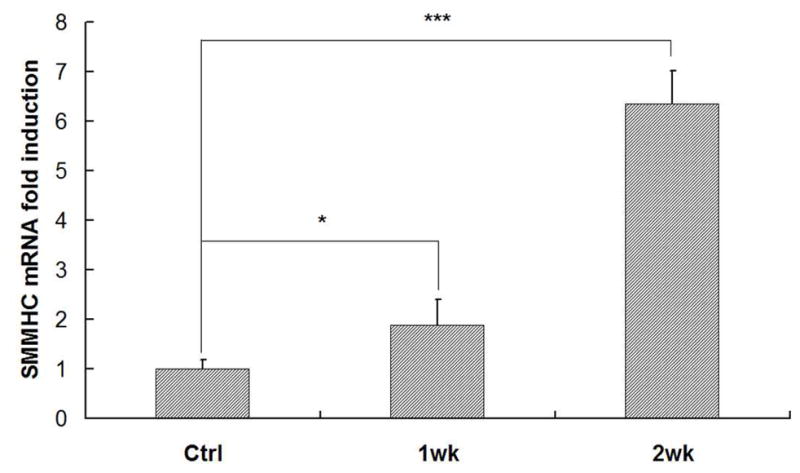
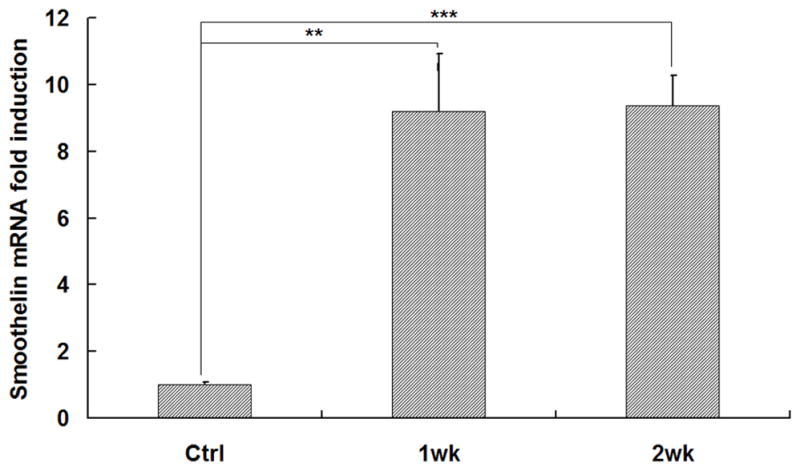
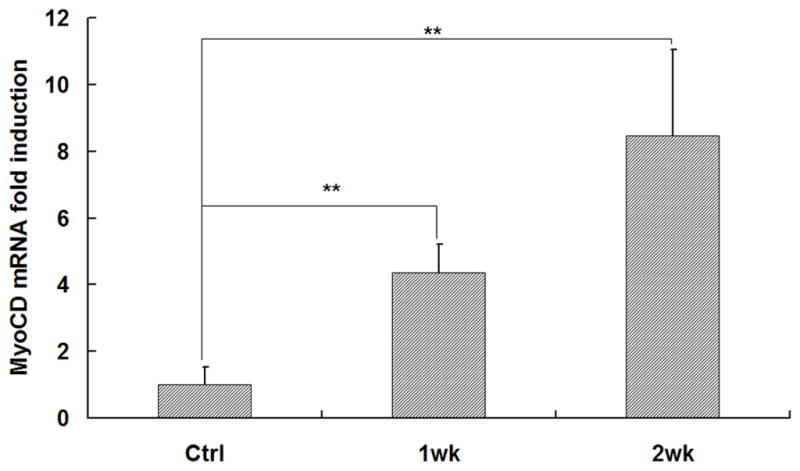
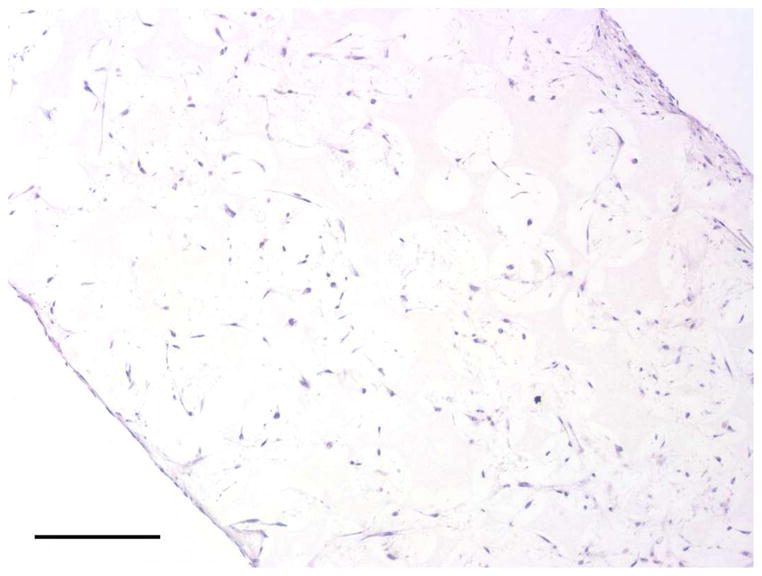
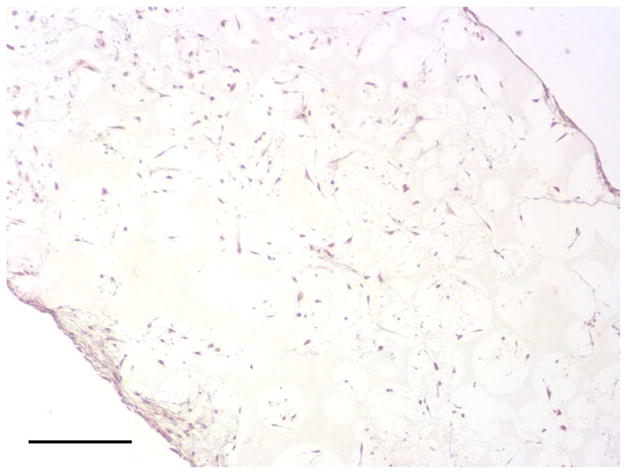
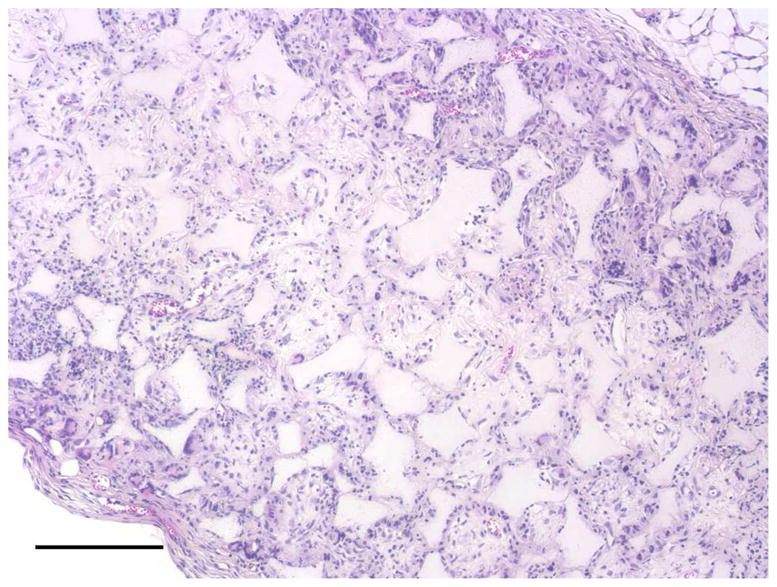
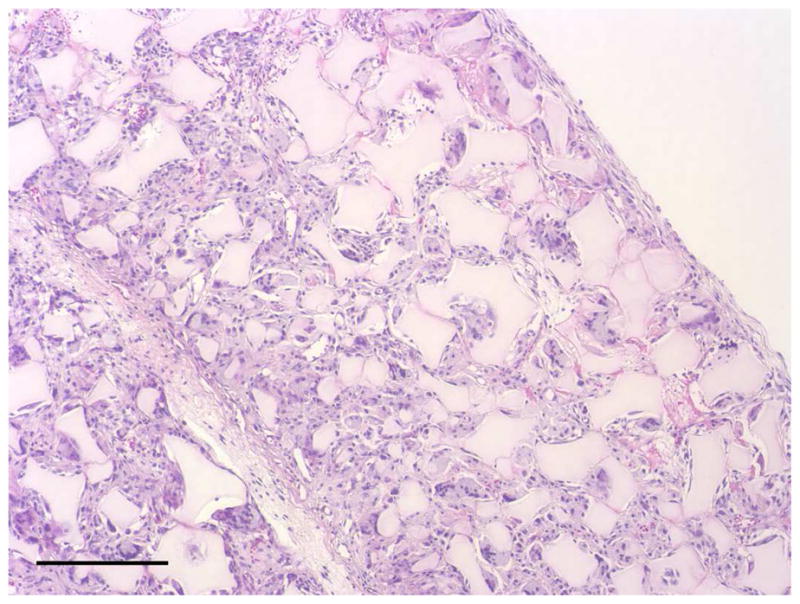
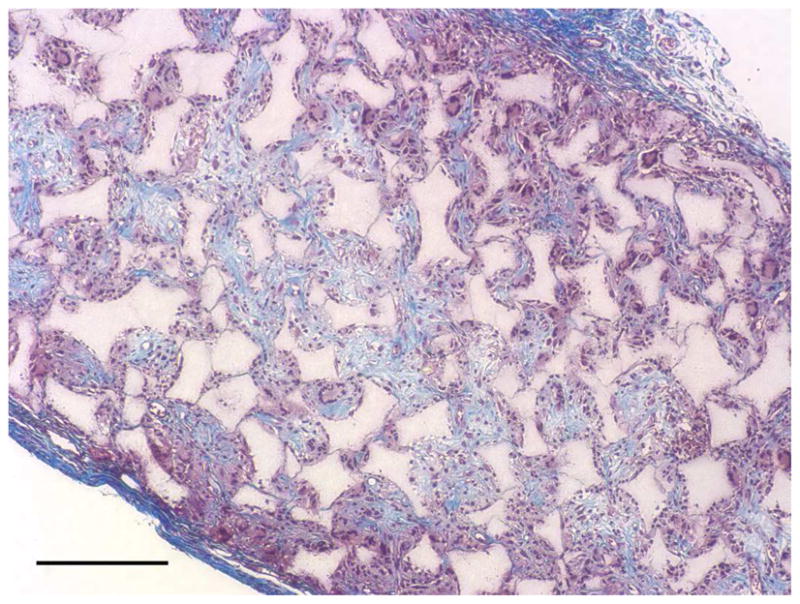
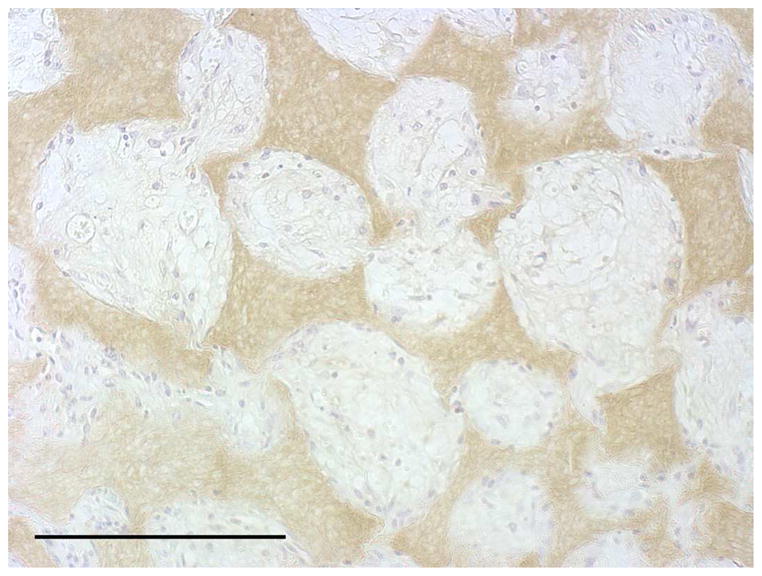
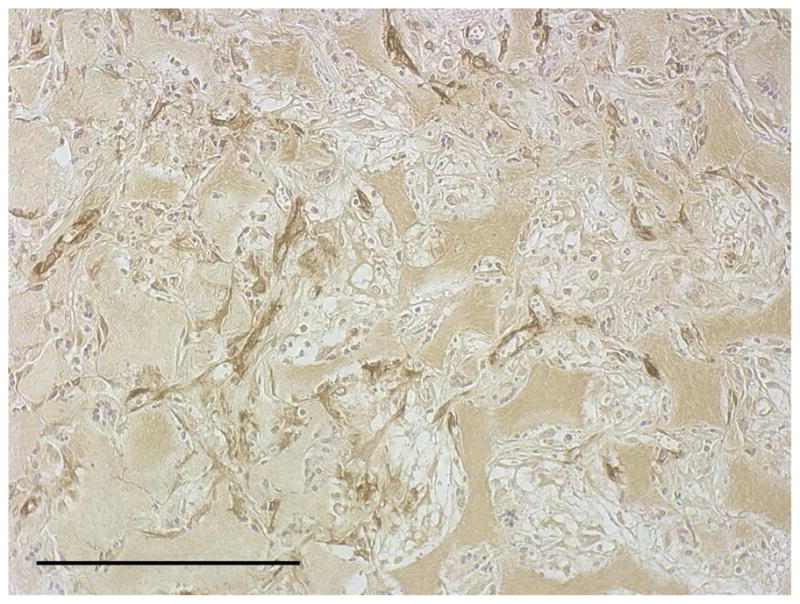
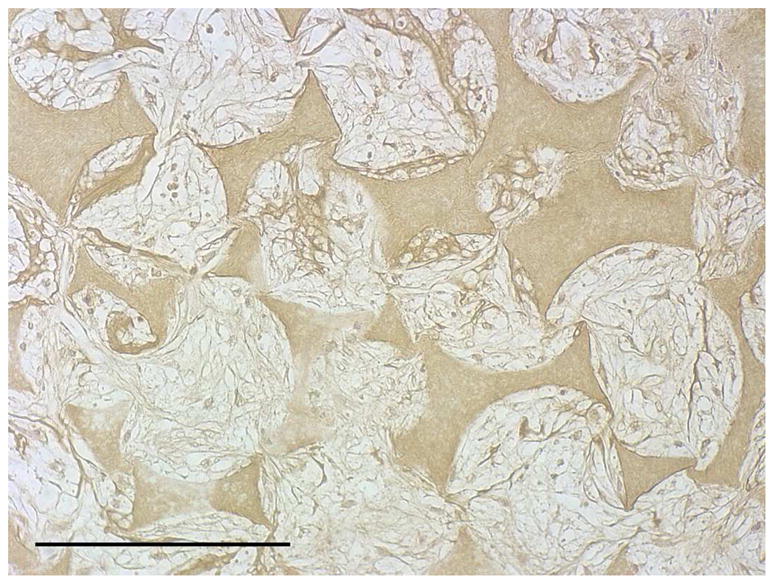
Tissue-engineered small-diameter vascular grafts are needed for patients requiring replacement of their injured coronary and below-the-knee vessels. Understanding the interactions between the scaffolds and implanted cells and therefore the phenotype control of smooth muscle cells (SMCs) is critical for constructing functional vascular grafts. In this study, the effect of nanofibrous (NF) poly-L-lactide (PLLA) scaffolds on phenotype control of human aortic smooth muscle cells (HASMCs) was investigated. A tubular NF PLLA scaffold for blood vessel regeneration was fabricated and cell seeding studies showed cell distribution throughout the scaffold. It was found that NF PLLA scaffolds preferentially supported contractile phenotype of HASMCs under the in vitro culture conditions, as evidenced by elevated gene expression level of SMCs contractile markers including smooth muscle myosin heavy chain, smoothelin and myocardin. In vivo subcutaneous implantation studies confirmed HASMCs differentiation in the implants. Taken together, the results showed promising application of the porous NF PLLA scaffolds for reconstruction of tissue-engineered vascular grafts.


Figures

Fig. 1
Fig. 1
SEM micrographs of HASMCs cultured on PLLA flat films (A) and NF matrices (B) after 24 hr of seeding and culture. The cells on NF matrices were more rounded compared to cells cultured on flat films. Gene expression of SMC specific markers was analyzed on flat films or NF matrices after 6 d of culture (C–E). ***P<0.001.
Fig. 1
Fig. 1
SEM micrographs of HASMCs cultured on PLLA flat films (A) and NF matrices (B) after 24 hr of seeding and culture. The cells on NF matrices were more rounded compared to cells cultured on flat films. Gene expression of SMC specific markers was analyzed on flat films or NF matrices after 6 d of culture (C–E). ***P<0.001.
Fig. 2
Fig. 2
Fabrication of tubular NF scaffolds and in vitro cell culture on the scaffolds. Gross view of the tubular scaffold (A). Scale bar: 5mm. SEM micrographs of cross-sectioned scaffold showing gross structures (B), macro-pores, pore interconnections (C), and NF structure (D). Histological analysis of in vitro cultured constructs for 1 wk, stained with H-E and observed at low (E) and high (F) magnifications. Scale bar: 200μm.
Fig. 2
Fig. 2
Fabrication of tubular NF scaffolds and in vitro cell culture on the scaffolds. Gross view of the tubular scaffold (A). Scale bar: 5mm. SEM micrographs of cross-sectioned scaffold showing gross structures (B), macro-pores, pore interconnections (C), and NF structure (D). Histological analysis of in vitro cultured constructs for 1 wk, stained with H-E and observed at low (E) and high (F) magnifications. Scale bar: 200μm.
Fig. 3
Fig. 3
In vitro culture of HASMCs on a 3D NF scaffold. SEM micrographs of the cell-scaffold construct after 24 hr of cell seeding and culture (A, B). Gene expression of SMC specific markers was analyzed after 1 wk and 2 wk of culture on scaffolds, compared to monolayer control culture (C–E). H-E staining (F) and Masson’s trichrome staining (G) of sections of constructs cultured for 2 wk. Scale bar: 200μm. * P<0.05, ** P<0.01, ***P<0.001.
Fig. 3
Fig. 3
In vitro culture of HASMCs on a 3D NF scaffold. SEM micrographs of the cell-scaffold construct after 24 hr of cell seeding and culture (A, B). Gene expression of SMC specific markers was analyzed after 1 wk and 2 wk of culture on scaffolds, compared to monolayer control culture (C–E). H-E staining (F) and Masson’s trichrome staining (G) of sections of constructs cultured for 2 wk. Scale bar: 200μm. * P<0.05, ** P<0.01, ***P<0.001.
Fig. 4
Fig. 4
In vivo implantation of HASMCs-scaffold constructs after 24 hr of cell seeding and culture: H-E staining of sections of constructs (A) and blank scaffolds (B) after 2 wk of implantation, Masson’s trichrome (C) staining of 2 wk implants of constructs (collagenous ECM stained blue). Immunohistochemical staining of IgG control 2 wk after implantation (D), the donor and host derived SMCs stained with SM-α-actin antibody (E) and the donor-derived HASMCs stained with human mitochondria antibody (F). Scale bar: 200μm.
Fig. 4
Fig. 4
In vivo implantation of HASMCs-scaffold constructs after 24 hr of cell seeding and culture: H-E staining of sections of constructs (A) and blank scaffolds (B) after 2 wk of implantation, Masson’s trichrome (C) staining of 2 wk implants of constructs (collagenous ECM stained blue). Immunohistochemical staining of IgG control 2 wk after implantation (D), the donor and host derived SMCs stained with SM-α-actin antibody (E) and the donor-derived HASMCs stained with human mitochondria antibody (F). Scale bar: 200μm.

Similar articles

Cited by

References

    1. Kannan RY, Salacinski HJ, Butler PE, Hamilton G, Seifalian AM. Current status of prosthetic bypass grafts: a review. J Biomed Mater Res B Appl Biomater. 2005;74(1):570–581. - PubMed
    1. Nerem RM, Seliktar D. Vascular tissue engineering. Annu Rev Biomed Eng. 2001;3:225–243. - PubMed
    1. Weinberg CB, Bell E. A blood vessel model constructed from collagen and cultured vascular cells. Science. 1986;231(4736):397–400. - PubMed
    1. Seliktar D, Black RA, Vito RP, Nerem RM. Dynamic mechanical conditioning of collagen-gel blood vessel constructs induces remodeling in vitro. Ann Biomed Eng. 2000;28(4):351–362. - PubMed
    1. Niklason LE, Gao J, Abbott WM, Hirschi KK, Houser S, Marini R, et al. Functional arteries grown in vitro. Science. 1999;284(5413):489–493. - PubMed

Publication types

MeSH terms