Comparative Study
. 2011 Feb;122(2):364-72.
doi: 10.1016/j.clinph.2010.07.010. Epub 2010 Aug 2.

Prediction of human voluntary movement before it occurs

Affiliations
Comparative Study

Prediction of human voluntary movement before it occurs

Ou Bai et al. Clin Neurophysiol. 2011 Feb.

Abstract

Objective: Human voluntary movement is associated with two changes in electroencephalography (EEG) that can be observed as early as 1.5 s prior to movement: slow DC potentials and frequency power shifts in the alpha and beta bands. Our goal was to determine whether and when we can reliably predict human natural movement BEFORE it occurs from EEG signals ONLINE IN REAL-TIME.

Methods: We developed a computational algorithm to support online prediction. Seven healthy volunteers participated in this study and performed wrist extensions at their own pace.

Results: The average online prediction time was 0.62±0.25 s before actual movement monitored by EMG signals. There were also predictions that occurred without subsequent actual movements, where subjects often reported that they were thinking about making a movement.

Conclusion: Human voluntary movement can be predicted before movement occurs.

Significance: The successful prediction of human movement intention will provide further insight into how the brain prepares for movement, as well as the potential for direct cortical control of a device which may be faster than normal physical control.


Figures

Fig. 1
Fig. 1
Screen shot of visual paradigm provided in each of four sessions. The computer continuously monitored the rectified bipolar EMG activity every 50 ms; once the EMG activity was larger than a pre-set threshold, the central box turned into a green color as in (b) and (f), and after 3 s, the central box disappeared as shown in (a) and (c); once blink or eye movement activity was detected from EOG signal, the central box turned red (d) to remind subjects that there were excessive eye movement artifacts, and after 1 s, the central box disappeared as shown in (e). (For interpretation of the references to color in this figure legend, the reader is referred to the web version of this paper.)
Fig. 2
Fig. 2
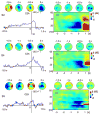
Small negative potentials of MRCPs (the left column) presented as early as 1.5 s before movement onset, which was maximized over central-medial area (supplementary motor area). ERD or power decrease presented by blue color in the right column was also observed about 1.5 s before movement onset. In contrast to the spatial distribution of MRCPs, ERD developed over the left motor area contralateral to the moving right hand. The ERD presented from low beta to high beta bands (16–30 Hz), which was maximized at movement onset. The alpha ERD in 8–12 Hz was less distinguishable than beta ERD. The frequency band for the topographic plot of ERD is 18–22 Hz indicated by dash-dot line in time–frequency plot. (For interpretation of the references to color in this figure legend, the reader is referred to the web version of this paper.)
Fig. 3
Fig. 3
Feature selection was determined from Bhattacharyya distance; a feature with higher value (in red) providing higher separability between active state that subject intended to move and idle/baseline state at rest. The channel index 1–27 corresponds to electrodes F3, F7, C3A, C1, C3, C5, T3, C3P, P3, T5, F4, F8, C4A, C2, C4, C6, T4, C4P, P4, T6, FPZ, FZ, FCZ, CZ, CZP, PZ and OZ. Features in beta band over left motor area provided best separability. (For interpretation of the references to color in this figure legend, the reader is referred to the web version of this paper.)
Fig. 4
Fig. 4
Screen shot from validation procedure for Subject 2 to determine a working point in order to reduce false positive predictions or ambiguous predictions that were made earlier than a desired time window from 1.5 s before movement to movement onset. See detail in the text.
Fig. 5
Fig. 5
Histogram of the predictions made proceeding movements from all subjects. Movement onset is at 0. Around 80% were true positive predictions that were made in the time window from 1.5 s to movement onset. The predictions made earlier than 1.5 s before movement were ambiguous predictions.

References

    1. Bai O, Lin P, Huang D, Fei DY, Floeter MK. Towards a user-friendly brain–computer interface: initial tests in ALS and PLS patients. Clin Neurophysiol. 2010;121:1293–303. - PMC - PubMed
    1. Bai O, Lin P, Vorbach S, Floeter MK, Hattori N, Hallett M. A high performance sensorimotor beta rhythm-based brain–computer interface associated with human natural motor behavior. J Neural Eng. 2008;5:24–35. - PubMed
    1. Bai O, Lin P, Vorbach S, Li J, Furlani S, Hallett M. Exploration of computational methods for classification of movement intention during human voluntary movement from single trial EEG. Clin Neurophysiol. 2007;118:2637–55. - PMC - PubMed
    1. Bai O, Mari Z, Vorbach S, Hallett M. Asymmetric spatiotemporal patterns of event-related desynchronization preceding voluntary sequential finger movements: a high-resolution EEG study. Clin Neurophysiol. 2005;116:1213–21. - PubMed
    1. Bai O, Vorbach S, Hallett M, Floeter MK. Movement-related cortical potentials in primary lateral sclerosis. Ann Neurol. 2006;59:682–90. - PubMed

Publication types