. 2010 Oct;192(19):5124-33.
doi: 10.1128/JB.00672-10. Epub 2010 Jul 30.

Bathy phytochromes in rhizobial soil bacteria

Affiliations

Bathy phytochromes in rhizobial soil bacteria

Gregor Rottwinkel et al. J Bacteriol. 2010 Oct.

Abstract

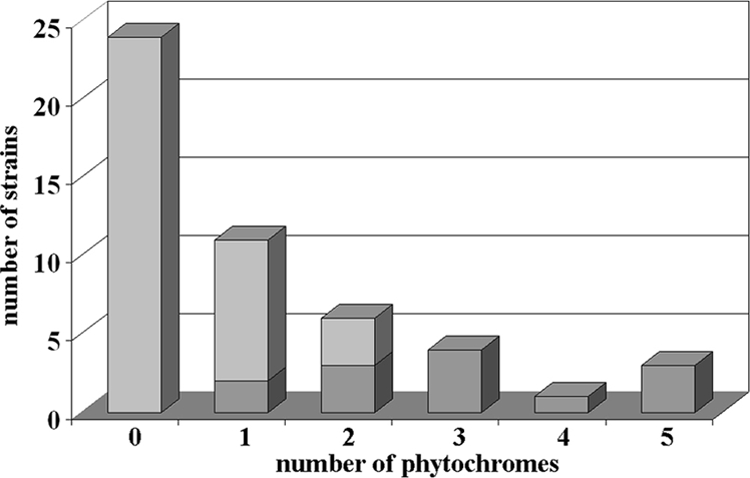
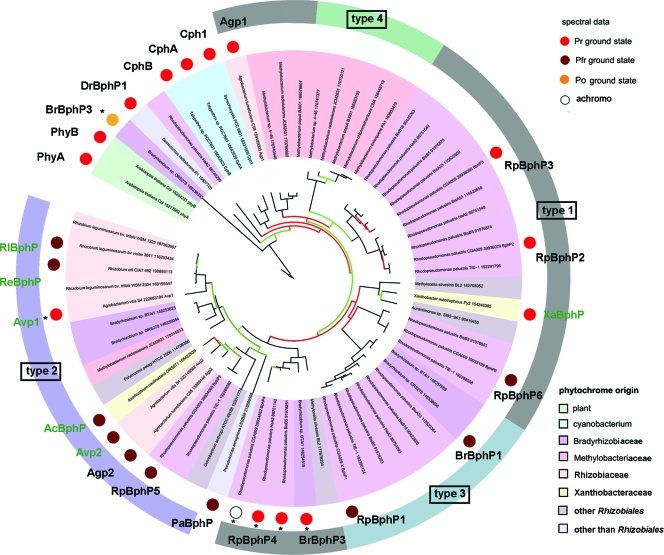
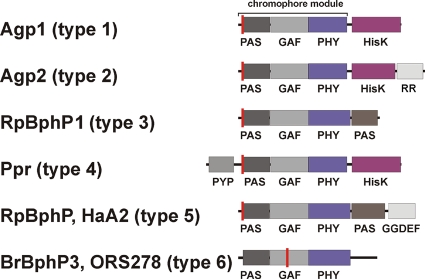
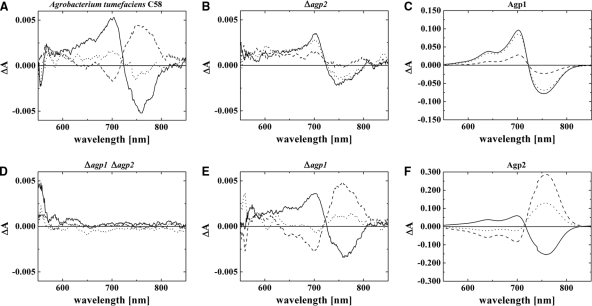
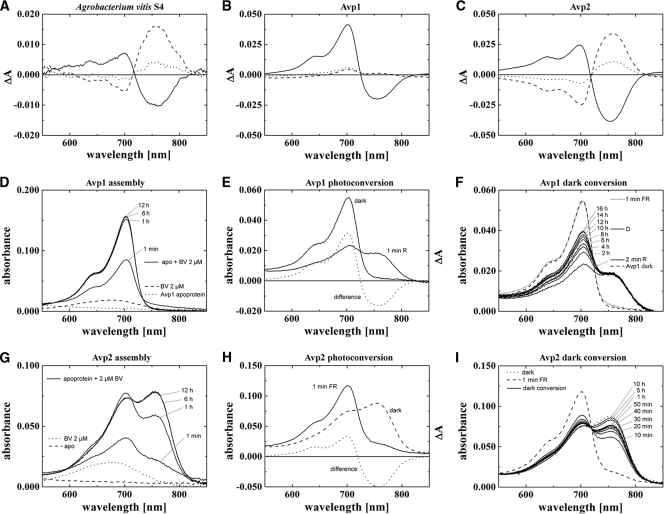
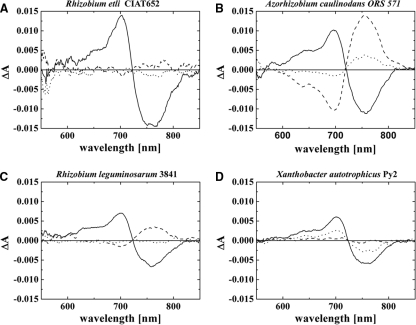
Phytochromes are biliprotein photoreceptors that are found in plants, bacteria, and fungi. Prototypical phytochromes have a Pr ground state that absorbs in the red spectral range and is converted by light into the Pfr form, which absorbs longer-wavelength, far-red light. Recently, some bacterial phytochromes have been described that undergo dark conversion of Pr to Pfr and thus have a Pfr ground state. We show here that such so-called bathy phytochromes are widely distributed among bacteria that belong to the order Rhizobiales. We measured in vivo spectral properties and the direction of dark conversion for species which have either one or two phytochrome genes. Agrobacterium tumefaciens C58 contains one bathy phytochrome and a second phytochrome which undergoes dark conversion of Pfr to Pr in vivo. The related species Agrobacterium vitis S4 contains also one bathy phytochrome and another phytochrome with novel spectral properties. Rhizobium leguminosarum 3841, Rhizobium etli CIAT652, and Azorhizobium caulinodans ORS571 contain a single phytochrome of the bathy type, whereas Xanthobacter autotrophicus Py2 contains a single phytochrome with dark conversion of Pfr to Pr. We propose that bathy phytochromes are adaptations to the light regime in the soil. Most bacterial phytochromes are light-regulated histidine kinases, some of which have a C-terminal response regulator subunit on the same protein. According to our phylogenetic studies, the group of phytochromes with this domain arrangement has evolved from a bathy phytochrome progenitor.


Figures

FIG. 1.
FIG. 1.
BphP genes in sequenced strains of Rhizobiales. The graph shows the number of strains carrying a given number of BphPs. Dark gray, photosynthetic; light gray, nonphotosynthetic.
FIG. 2.
FIG. 2.
Phylogenetic tree of Rhizobiales BphPs and additional phytochromes. Branches of the tree are given in black, green, and red for bootstrap values of >75%, >50%, and <50%, respectively. Colors underlying the strain names indicate taxonomic groups according to the color key at the bottom of the figure. The ground states of spectrally characterized phytochromes are marked by large colored dots according to the key at the top of the figure. Common abbreviations are also given for these phytochromes. The following phytochromes were characterized earlier (reference): Agp1 (26), Agp2 (18), Bradyrhizobium ORS278 BrBphP1 (10), Bradyrhizobium ORS278 BrBphP3 (15), Bradyrhizobium strain BTAi1 BrBphP3 (11), Cph1 (27), CphA (17), CphB (17), DrBphP1 (7), PaBphP (40), PhyA (36), PhyB (36), RpBphP1 (11), RpBphP2 (12), RpBphP3 (8), R. palustris CGA009/HaA2/BisB5 RpBphP4 (42), RpBphP5 (11), and RpBphP6 (11). The domain arrangements of type 1 through type 4 Rhizobiales phytochromes are indicated by the colored circle segments around the tree. Asterisks indicate phytochromes with unusual spectral characteristics.
FIG. 3.
FIG. 3.
Domain arrangements of BphPs from examined strains (Agp1 and Agp2 from A. tumefaciens C58; RpBphP [gi 86749290] and RpBphP1 from R. palustris HaA2 and CGA009, respectively; BrBphP3 from Bradyrhizobium sp. ORS278; and Ppr from R. centenum SW). Domain arrangements were drawn according to PFAM results. The indicated domains are as follows: PAS, Per-Arnt-Sim; GAF, cGMP-specific and -regulated cyclic nucleotide phosphodiesterase, adenylyl cyclase, and E. coli transcription factor FhlA; PHY, phytochrome-specific; HisK, histidine kinase; and RR, response regulator. The chromophore binding site is indicated by the red line.
FIG. 4.
FIG. 4.
Difference spectra of bacterial cell sediments of A. tumefaciens C58 wild type (WT) (A) and agp1 agp2 (D), agp2 (B), agp1 (E) knockout mutants and recombinant proteins Agp1 (C) and Agp2 (F). Photoconversion (solid lines), difference spectra obtained from subtracting absorbance spectra after R from spectra after FR; dark conversion after FR (dotted lines), spectra after 1 h dark of incubation minus spectra after subsequent FR (a positive signal around 700 nm indicates Pfr to Pr dark conversion); dark conversion after R (dashed lines), spectra after 1 h of dark incubation minus spectra after R (a positive signal around 750 nm indicates Pr to Pfr dark conversion). All samples were measured with an Ulbricht sphere; details are given in the Materials and Methods section.
FIG. 5.
FIG. 5.
A. vitis S4 phytochrome spectra. (A) In vivo difference spectra of A. vitis bacterial cell sediment. (B and C) Difference spectra of recombinant Avp1 and Avp2, measured with the Ulbricht sphere. (D to F) Absorption and difference spectra of recombinant Avp1 during assembly (D), photoconversion (E), and dark conversion (E) as measured with standard setup (without the Ulbricht sphere). (G to I) Absorption and difference spectra of recombinant Avp2 during assembly (G), photoconversion (H), and dark conversion (I) as measured with a standard setup. For panels A to C solid lines indicate difference spectra obtained from subtracting absorption spectra after R from absorption spectra after FR, dotted lines indicate spectra after 1 h of dark incubation subtracted from spectra after FR (a positive signal around 700 nm indicates Pfr-to-Pr dark conversion), and dashed lines indicate spectra after 1 h of dark incubation subtracted from spectra after R (a positive signal around 750 nm indicates Pr-to-Pfr dark conversion). Symbols in panels D to I are identified on the figure.
FIG. 6.
FIG. 6.
Avp1 spectra. The black line shows the Pr spectrum of the dark-assembled sample, the red line gives the calculated Pfr spectrum under the assumption that the Pfr fraction in the red-irradiated sample after 18 h of dark incubation is 0.52. The other spectra are calculated for Pbl under the assumption that the Pfr fraction in the R-treated sample is always 0.52, and the Pr fraction is 0, 0.1, 0.15, 0.2, or 0.22, as indicated on the figure. The positions of the absorption maxima are also given on the figure.
FIG. 7.
FIG. 7.
Difference spectra of bacterial cell sediments of R. etli, A. caulinodans, R. leguminosarum, and X. autotrophicus are shown. Solid lines, difference spectra obtained from subtracting absorbance spectra after far-red irradiation (780 nm) from absorption spectra after red irradiation (655 nm); dotted lines, spectra after 1 h of dark incubation subtracted from spectra after far-red irradiation (a positive signal around 700 nm indicates Pfr-to-Pr dark conversion); dashed lines, spectra after 1 h of dark incubation subtracted from spectra after red irradiation (a positive signal around 750 nm indicates Pr-to-Pfr dark conversion).

References

    1. Bhoo, S. H., S. J. Davis, J. Walker, B. Karniol, and R. D. Vierstra. 2001. Bacteriophytochromes are photochromic histidine kinases using a biliverdin chromophore. Nature 414:776-779. - PubMed
    1. Borucki, B., and T. Lamparter. 2009. A polarity probe for monitoring light induced structural changes at the entrance of the chromophore pocket in a bacterial phytochrome. J. Biol. Chem. 38:26005-26016. - PMC - PubMed
    1. Borucki, B., D. von Stetten, S. Seibeck, T. Lamparter, N. Michael, M. A. Mroginski, H. Otto, D. H. Murgida, M. P. Heyn, and P. Hildebrandt. 2005. Light-induced proton release of phytochrome is coupled to the transient deprotonation of the tetrapyrrole chromophore. J. Biol. Chem. 280:34358-34364. - PubMed
    1. Butler, W. L. 1964. Absorption spectroscopy in vivo—theory and application. Annu. Rev. Plant Physiol. 15:451-470.
    1. Butler, W. L., H. C. Lane, and H. W. Siegelman. 1963. Nonphotochemical transformations of phytochrome in vivo. Plant Physiol. 38:514-519. - PMC - PubMed

Publication types

MeSH terms

LinkOut - more resources