Review
. 2010 Oct;89(10):1024-38.
doi: 10.1177/0022034510375829. Epub 2010 Jul 30.

Regulation of dental enamel shape and hardness

Affiliations
Review

Regulation of dental enamel shape and hardness

J P Simmer et al. J Dent Res. 2010 Oct.

Abstract

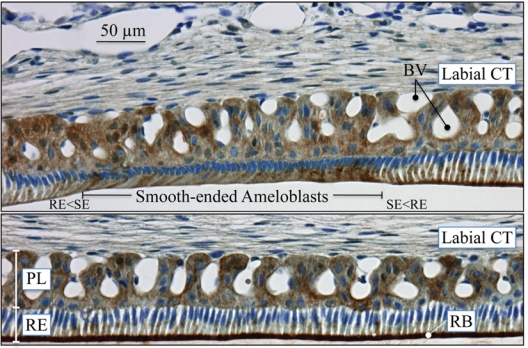
Epithelial-mesenchymal interactions guide tooth development through its early stages and establish the morphology of the dentin surface upon which enamel will be deposited. Starting with the onset of amelogenesis beneath the future cusp tips, the shape of the enamel layer covering the crown is determined by five growth parameters: the (1) appositional growth rate, (2) duration of appositional growth (at the cusp tip), (3) ameloblast extension rate, (4) duration of ameloblast extension, and (5) spreading rate of appositional termination. Appositional growth occurs at a mineralization front along the ameloblast distal membrane in which amorphous calcium phosphate (ACP) ribbons form and lengthen. The ACP ribbons convert into hydroxyapatite crystallites as the ribbons elongate. Appositional growth involves a secretory cycle that is reflected in a series of incremental lines. A potentially important function of enamel proteins is to ensure alignment of successive mineral increments on the tips of enamel ribbons deposited in the previous cycle, causing the crystallites to lengthen with each cycle. Enamel hardens in a maturation process that involves mineral deposition onto the sides of existing crystallites until they interlock with adjacent crystallites. Neutralization of acidity generated by hydroxyapatite formation is a key part of the mechanism. Here we review the growth parameters that determine the shape of the enamel crown as well as the mechanisms of enamel appositional growth and maturation.


Figures

Figure 1.
Figure 1.
Incremental lines in teeth. (A) Ground section of enamel showing how perikymata (P) are surface manifestations of the striae of Retzius (SR) (Nanci, 2008a). (B) Line drawing showing the striae of Retzius in a molar (Nanci, 2008a). The striae of Retzius are long-period (6- to 11-day) growth lines that extend from the DEJ to the enamel surface. They show where the enamel surface was at one day during development. There are no perikymata at the cusp tip, because the Retzius lines run continuously in an elliptical arc from the DEJ on one side of the cusp tip to the DEJ on the other side of the cusp tip without breaking the surface. (C) Ground section of dentin (Dean, 1998) showing short-period growth lines (von Ebner’s lines: the curved, periodically repeating, inverted V’s in image). (D) Autoradiograph of rat dentin section showing 9 densely labeled circumpulpal bands formula image 
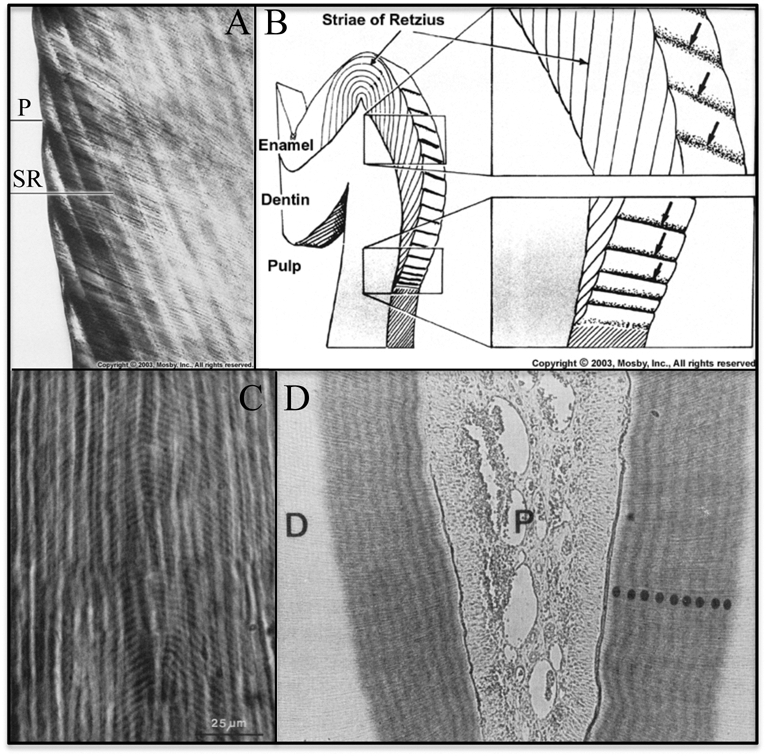
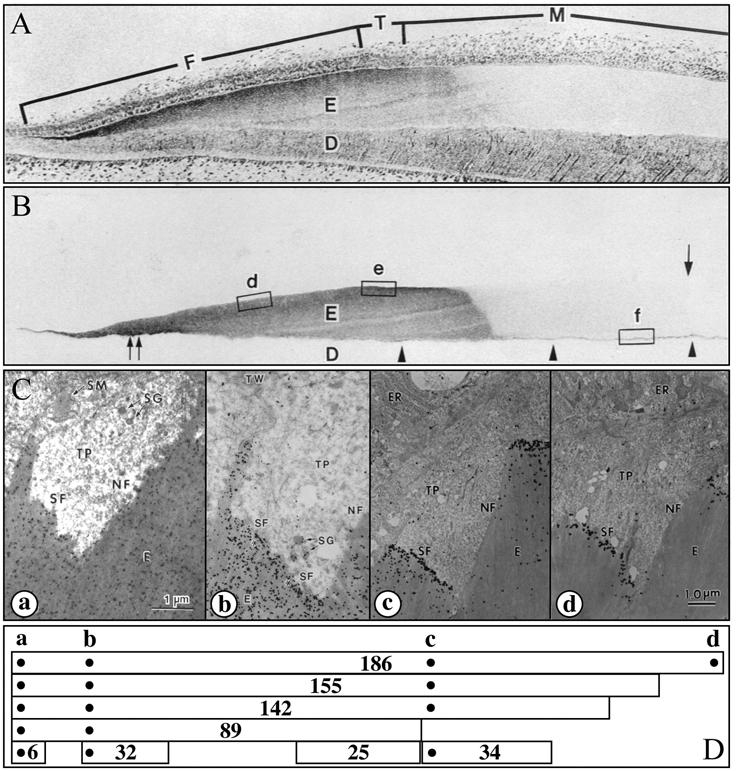
after infusion with labeled proline for 10 days, suggesting daily fluctuations in the secretion of collagen (Ohtsuka et al., 1998).
Figure 2.
Figure 2.
Daily variation in ameloblast secretion of proteins containing methionine. Graph of means ± 95% confidence interval illustrating the total amount of newly synthesized proteins released into developing enamel on rat mandibular incisors by 1 hr after a single intravenous injection of 3H-methionine administered at different times of the day. Substantially greater amounts of secretory activity for enamel proteins occur in the late afternoon (4:00 p.m., diamonds) compared with early morning (8:00 a.m., circles) throughout the secretory stage. These differences are noticeably larger (up to 40%) for inner enamel formation (distance, 0.5-3.0 mm) than for outer enamel formation (20%). Each datapoint represents mean counts of sections from 6 incisors per time-point. Technical information about how animals were injected, tissues were processed, and quantitative data were obtained by computerized image analysis has been described previously (Smith and Nanci, 1996).
Figure 3.
Figure 3.
Pattern of ameloblast differentiation during crown formation. (A) Section through the developing primate cusp tip. Pre-ameloblasts first differentiate from inner enamel epithelia on the dentin surface covering the pulp horn (1) beneath what will become the cusp tip. From this beginning, a wave of ameloblast differentiation moves through the inner enamel epithelia down the slope of the mineralized dentin surface (2). Key: am, ameloblasts; od, odontoblasts; ek, enamel knot; p, pulp; si, stratum intermedium; sr, stellate reticulum. (B) Incisor split open to show the growth parameters that determine the shape of the enamel crown once earlier developmental processes establish the dentin surface. (1) Ameloblasts differentiate beneath the future cusp tip and deposit the first increment of enamel. (2) A wave of ameloblast differentiation extends down the slope of the dentin surface and ends when it reaches its limit, where the inner enamel epithelium previously fused with the outer enamel epithelium to form Hertwig’s epithelial root sheath. (3) Enamel mineral builds up in daily increments (appositional growth) during the secretory stage of amelogenesis. (4) Ameloblasts at the cusp tip end the secretory stage (appositional growth) and transition into maturation-stage ameloblasts. (5) A wave of ameloblast re-organization that terminates the secretory stage and transitions the ameloblasts into the maturation stage moves down the enamel surface. (6) Ameloblast termination reaches the last secretory ameloblasts at the cervical margin, and the shape of the enamel crown is established. After this point, the entire crown is in maturation stage, which involves the removal of residual enamel proteins and the growth of existing enamel crystallites in width and thickness.
Figure 4.
Figure 4.
Models depicting enamel apposition while varying the extension and termination rates. An inverted parabola populated with virtual ameloblasts represents the hypothetical DEJ. Ameloblast activation sweeps from the horn of the DEJ down the length of the curve, with the rate of extension decreasing exponentially down the slope of the tooth. Once activated, cells move along vectors normal to the DEJ at a fixed rate. Black lines represent the positions of the secretory front at evenly spaced time intervals (t0, t1, t2, . . .) and can be thought of as virtual striae of Retzius. Bold lines with arrows show how the wave of activation moves down the DEJ. The appositional growth rate and duration of appositional growth (at the cusp tip) are identical in both models. Extension ends when the wave of termination reaches the wave of activation. (A) In this simulation, a wave of ameloblast activation moves down the crown at a rate based on an exponential decay equation with a decay constant of 0.025. The wave of appositional termination moves down the crown at a constant rate that is rapid relative to the rate at which the wave of activation advances. (B) In this simulation, a lower decay constant of 0.01 was used for activation, resulting in a slower advance of the wave. Termination of apposition moves down the crown at a rate defined by an exponential decay equation with a decay constant of 0.02.
Figure 5.
Figure 5.
Enamelin localization in developing enamel. (A,B) Consecutive sections of a developing porcine incisor. The top section is stained with toluidine blue; the second section is immunostained with the 32-kDa enamelin antibody (Uchida et al., 1991a). The 32-kDa enamelin signal is observed throughout the secretory stage in the enamel matrix, from the DEJ to the surface. However, because enamelin is extensively processed by proteases and the C-terminal parts are removed from the matrix, its distribution depends upon which part of the protein is recognized by the antibody. (C,D) Transmission electron microscopy (TEM) showing immunogold staining patterns of forming enamel near the ameloblast Tomes’ processes using affinity-purified anti-peptide antibodies raised against the enamelin (a) N-terminus (Dohi et al., 1998), (b) 32-kDa cleavage product (Uchida et al., 1991a), (c) 34-kDa cleavage product (Hu et al., 1997a), and (d) C-terminus (Hu et al., 1997a). Note that each antibody shows a different localization pattern. Below the TEMs are diagrams showing enamelin (186 kDa) and known cleavage products (155, 142, 89, 34, 32, 25, and 6 kDa) and the positions of the sequences used to make antibodies (dots) (Hu and Yamakoshi, 2003). An important observation is that the enamelin C-terminus is found only at the mineralization front (d).
Figure 6.
Figure 6.
The secretory-stage mineralization front. Arrowheads mark the mineralization front. (A) TEM of developing human tooth showing enamel crystallites extending from a layer of enamel proteins along the secretory surface of the ameloblast distal membrane (Ronnholm, 1962). [Note: In Fig. 5C part d, we show that intact enamelin (containing the C-terminus) is found only along the mineralization front.] (B,C) Von Kossa (which turns mineralized tissues dark) -stained sections of developing mouse teeth (dentin, d; enamel, e). (B) Enamelin heterozygous (+/–) mouse section showing that both the dentin and enamel layers are mineralized. (C) Enamelin null mouse (–/–) showing that, without enamelin, the mineralization front fails and does not stimulate enamel mineralization. Only small, punctate foci of mineralization are detected within the enamel layer near the dentino-enamel junction, despite there being a thick accumulation of organic material (light blue) in the enamel layer (Hu et al., 2008).
Figure 7.
Figure 7.
Immunohistochemistry of clock protein in a post-natal day 4 mouse. (A) Clock protein expression was detected in the developing first molars. (B,C) Higher magnifications showing that the nuclei (arrows) of ameloblasts (AM) and odontoblasts (OD) have strong clock expression relative to the dental pulp (DP) cells. Samples were fixed at 4°C for 4 hrs in 4% formalin, washed (3x) with rinse buffer (2 mM MgCl2 and 0.1% Nonidet P40 in PBS), demineralized in EDTA for 2 wks, embedded in paraffin, and sectioned. The sections (~4 µm) were rehydrated, blocked, treated for antigen retrieval in 10 mM sodium citrate for 30 min by being microwaved prior to incubation with an anti-clock primary antibody (dilution 1:100; Calbiochem, San Diego, CA, USA) for 1 hr at room temperature, followed by incubations with a biotinylated secondary antibody (1:200, Vector Laboratories, Burlingame, CA, USA) and a horseradish peroxidase-streptavidin conjugate (1:200, Zymed, San Francisco, CA, USA). Signal was detected by means of the DAB Plus Substrate kit (Zymed).
Figure 8.
Figure 8.
Major activities of maturation stage ameloblasts. (A) Calcium (Ca2+) and phosphate (H2PO4- and HPO42-) ions are transported and add to the width and thickness of existing calcium hydroxyapatite crystals generating hydrogen ions (H+). (B) Enamel proteins are cleaved by kallikrein (KLK4) and reabsorbed into the cells, possibly with the assistance of WDR72. (C) Magnesium ions (Mg2+) are potentially removed from the matrix by CNNM4. (D) Carbonic anhydrase II (CA2) catalyzes the combination of carbon dioxide (CO2) and water (H2O) to form a bicarbonate ion (HCO3-) and a hydrogen ion. The H+ is removed from the cell, possibly by the action of a sodium (Na+) and hydrogen ion exchanger (NHE) on the proximal membrane. The bicarbonate ion is transported into the matrix by exchanging it for a chloride ion (Cl-) by anion exchanger 2 (AE2). The cystic fibrosis transmembrane regulator protein may facilitate this exchange by transporting Cl- out of the cell and into the matrix. (E) Carbonic anhydrase VI (CA6) catalyzes the combination of bicarbonate and a hydrogen ion generated by hydroxyapatite formation to form carbon dioxide and water. ODAM and amelotin (AMTN) are components of the basal lamina along the distal membrane of ameloblasts throughout the maturation stage. No attempt has been made to distinguish between the activities of ruffle-ended and smooth ended ameloblasts. The proximal side of the ameloblast is at the top; the distal side is at the bottom. The enamel rod images are from Nanci (2003).
Figure 9.
Figure 9.
Immunohistochemistry of carbonic anhydrase VI distribution in maturation-stage ameloblasts of the rat incisor. CA6 localizes primarily to membrane invaginations along the distal surface of ruffle-ended ameloblasts (bottom panel). Strong reactions for CA6 are also evident in some papillary layer cells, especially in areas near blood vessels. The maxillary incisors of 100 g male rats were perfused via the vascular system for 20 min with 4% paraformaldehyde + 0.1% glutaraldehyde in 0.8 M sodium cacodylate buffer + 0.05% calcium chloride, pH 7.2. The jaws were decalcified for 3 wks in disodium EDTA, washed, then processed for embedding in paraffin. The sections (~5 µm) were treated for antigen retrieval in 10 mM sodium citrate for 15 min by being microwaved prior to immunolocalization with the anti-CA6 antibody, which was custom-made by Affinity BioReagents (Thermo Fisher Scientific, Inc., Rockford, IL, USA). The CA6 antibody is an affinity-purified chicken anti-rat IgY (egg yolk) antibody raised against the peptide CGGERQSPIDVKRREVHFSS, from near the rat CA6 N-terminus (aa 41–60). The CA6 antibody was incubated at 1:1000 dilution overnight at 4°C. The secondary rabbit anti-chicken antibody was incubated for 30 min on the section and then revealed with an immunoperoxidase kit (Vector Laboratories, Burlingame, CA, USA). The slide was counterstained with toluidine blue. Key: BV, blood vessels; CT, connective tissue; PL, papillary layer; RB, ruffled border; RE, ruffle-ended ameloblasts; SE, smooth-ended ameloblasts; transition zones between ruffled and smooth-ended ameloblasts, RE<SE and SE<RE.

References

    1. Adeleke-Stainback P, Chen E, Collier P, Yuan ZA, Piddington R, Decker S, et al. (1995). Analysis of the regulatory region of the bovine X-chromosomal amelogenin gene. Connect Tissue Res 32:115-118 - PubMed
    1. Al Kawas S, Warshawsky H. (2008). Ultrastructure and composition of basement membrane separating mature ameloblasts from enamel. Arch Oral Biol 53:310-317 - PubMed
    1. Almaani N, Liu L, Dopping-Hepenstal PJ, Lovell PA, Lai-Cheong JE, Graham RM, et al. (2009). Autosomal dominant junctional epidermolysis bullosa. Br J Dermatol 160:1094-1097 - PubMed
    1. Amir S, Lamont EW, Robinson B, Stewart J. (2004). A circadian rhythm in the expression of PERIOD2 protein reveals a novel SCN-controlled oscillator in the oval nucleus of the bed nucleus of the stria terminalis. J Neurosci 24:781-790 - PMC - PubMed
    1. Aoba T, Moreno EC. (1987). The enamel fluid in the early secretory stage of porcine amelogenesis: chemical composition and saturation with respect to enamel mineral. Calcif Tissue Int 41:86-94 - PubMed

Publication types

LinkOut - more resources