. 2010 Sep-Oct;2(5):576-88.
doi: 10.4161/mabs.2.5.12833. Epub 2010 Sep 1.

Properties of a general PK/PD model of antibody-ligand interactions for therapeutic antibodies that bind to soluble endogenous targets

Affiliations

Properties of a general PK/PD model of antibody-ligand interactions for therapeutic antibodies that bind to soluble endogenous targets

Jasmine P Davda et al. MAbs. 2010 Sep-Oct.

Abstract

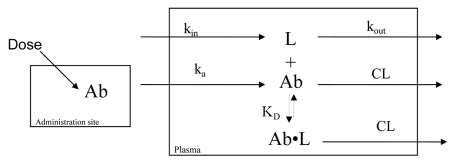
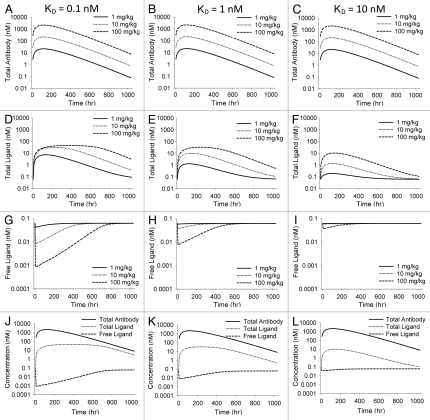
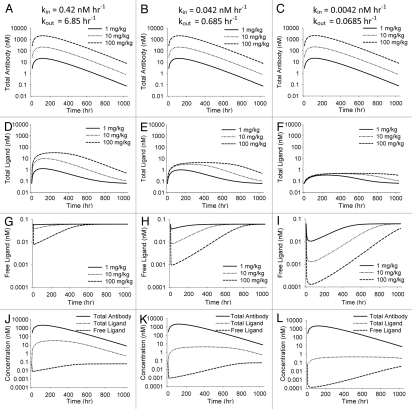
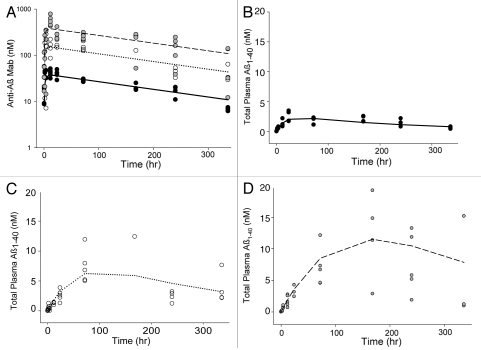
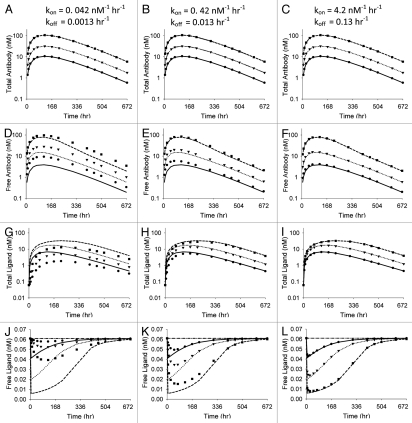
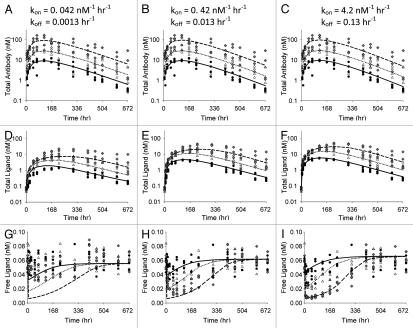
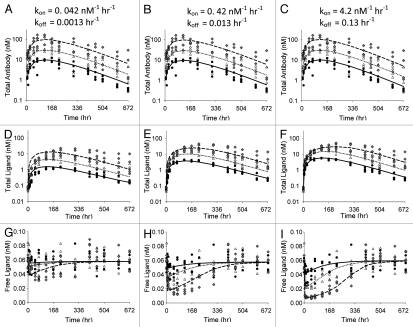
Antibodies that target endogenous soluble ligands are an important class of biotherapeutic agents. While much focus has been placed on characterization of antibody pharmacokinetics, less emphasis has been given to characterization of antibody effects on their soluble targets. We describe here the properties of a generalized mechanism-based PK/PD model used to characterize the in vivo interaction of an antibody and an endogenous soluble ligand. The assumptions and properties of the model are explored, and situations are described when deviations from the basic assumptions may be necessary. This model is most useful for in vivo situations where both antibody and ligand levels are available following drug administration. For a given antibody exposure, the extent and duration of suppression of free ligand is impacted by the apparent affinity of the interaction, as well as by the rate of ligand turnover. The applicability of the general equilibrium model of in vivo antibody-ligand interaction is demonstrated with an anti-Aß antibody.


Figures

Figure 1
Figure 1
Schematic diagram of the basic equilibrium model. Ab represents antibody concentration; ka is a 1st-order absorption rate constant for the antibody; V is the apparent volume of distribution for the antibody; CL is the apparent clearance for the antibody; L is free ligand concentration; kin is a zero-order input rate constant for ligand (units of concentration/time); kout is a 1st-order rate constant for free ligand elimination; KD is the equilibrium constant governing antibody-ligand binding; Ab•L is concentration of antibody-ligand complex.
Figure 2
Figure 2
Simulations illustrating effects of varying KD in the general antibody-ligand PK/PD model. All parameters except KD were held constant throughout simulations. KD was 0.1, 1 and 10 nM for the three scenarios. Effect of varying KD on total antibody concentration (A–C), total ligand (D–F) and free ligand (G–I) are shown. (J–L) show total antibody, total ligand and free ligand on the same plot for each scenario at a 100 mg/kg dose of antibody.
Figure 3
Figure 3
Simulations illustrating effect of varying kin and kout in the general antibody-ligand PK/PD model. All parameters except kin and kout were held constant throughout simulations and the ratio of kin to kout was held constant at 0.061. kin was 0.42, 0.042 and 0.0042 nM h−1 for the three scenarios. Effect of varying kin and kout on total antibody concentration (A–C), total ligand concentration (D–F) and free ligand concentration (G–I) are shown. (J–L) show total antibody, total ligand and free ligand concentrations on the same plot for each scenario at a 100 mg/kg dose of antibody.
Figure 4
Figure 4
Observed and model predicted antibody and ligand (Aβ1–40) levels obtained using the general equilibrium model to fit m266 PK and ligand data in the PDAPP mouse. Symbols represent individual animal data and lines are population means for doses of 0.5 (●, —), 2 (○, ⋯) and 5 (●, ---) mg/kg of antibody. Antibody concentrations are shown in (A) with total ligand concentrations following 0.5, 2 and 5 mg/kg m266 shown in (B–D) respectively.
Figure 5
Figure 5
Antibody and ligand levels obtained by simulation using the non-equilibrium model (symbols) for 3 kon/koff scenarios compared with simulations obtained using the equilibrium model (lines). All parameters except kon and koff were held constant throughout simulations and the ratio of koff and kon was held constant at 0.03 nM. Symbols and lines are population means for n = 4 for doses of 0.5 (●, —), 1.5 (▼, ···) and 5 (■, ---) mg/kg of antibody. Vehicle control is also shown for the free ligand plots (-●-). Total antibody concentrations (A–C), free antibody concentrations (D–F), total ligand concentrations (G–I) and free ligand concentrations (J–L) are shown.
Figure 6
Figure 6
Total antibody (A–C) and total ligand (D–F) concentrations for 3 kon/koff scenarios fitted to the equilibrium model. Symbols represent simulated data used for fitting and lines represent model predicted means for doses of 0.5 (●, —), 1.5 (△, ⋯) and 5 (◆, ---) mg/kg of antibody. Plots in (G–I) illustrate comparison between simulated data and model predicted mean free ligand concentrations.
Figure 7
Figure 7
Total antibody (A–C), total ligand (D–F) and free ligand (G–I) concentrations for 3 kon/koff scenarios fitted simultaneously to the equilibrium model. Symbols represent simulated data used for fitting and lines represent model predicted means for doses of 0.5 (●, —), 1.5 (△, ⋯) and 5 (◆, ---) mg/kg of antibody.

References

    1. Wang W, Wang EQ, Balthasar JP. Monoclonal antibody pharmacokinetics and pharmacodynamics. Clin Pharmacol Ther. 2008;84:548–558. - PubMed
    1. Benincosa LJ, Chow FS, Tobia LP, Kwok DC, Davis CB, Jusko WJ. Pharmacokinetics and pharmacodynamics of a humanized monoclonal antibody to factor IX in cynomolgus monkeys. J Pharmacol Exp Ther. 2000;292:810–816. - PubMed
    1. Chow FS, Benincosa LJ, Sheth SB, Wilson D, Davis CB, Minthorn EA, et al. Pharmacokinetic and pharmacodynamic modeling of humanized anti-factor IX antibody (SB 249417) in humans. Clin Pharmacol Ther. 2002;71:235–245. - PubMed
    1. Jit M, Henderson B, Stevens M, Seymour RM. TNF-alpha neutralization in cytokine-driven diseases: a mathematical model to account for therapeutic success in rheumatoid arthritis but therapeutic failure in systemic inflammatory response syndrome. Rheumatology (Oxford) 2005;44:323–331. - PubMed
    1. Hayashi N, Tsukamoto Y, Sallas WM, Lowe PJ. A mechanism-based binding model for the population pharmacokinetics and pharmacodynamics of omalizumab. Br J Clin Pharmacol. 2007;63:548–561. - PMC - PubMed

LinkOut - more resources