. 2010 Aug;10(4):247-57.
doi: 10.1038/tpj.2010.34.

Consistency of predictive signature genes and classifiers generated using different microarray platforms

Affiliations

Consistency of predictive signature genes and classifiers generated using different microarray platforms

X Fan et al. Pharmacogenomics J. 2010 Aug.

Abstract

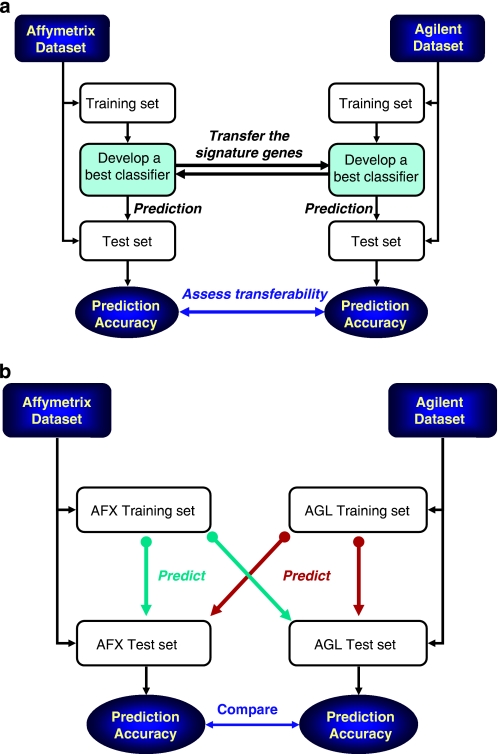
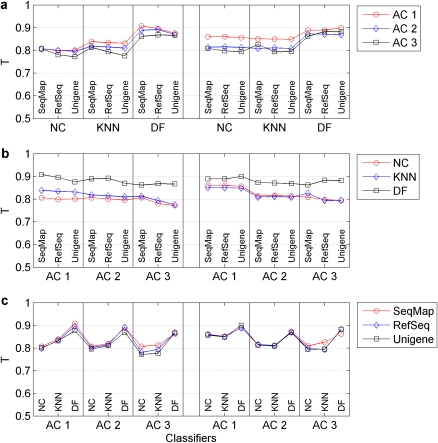
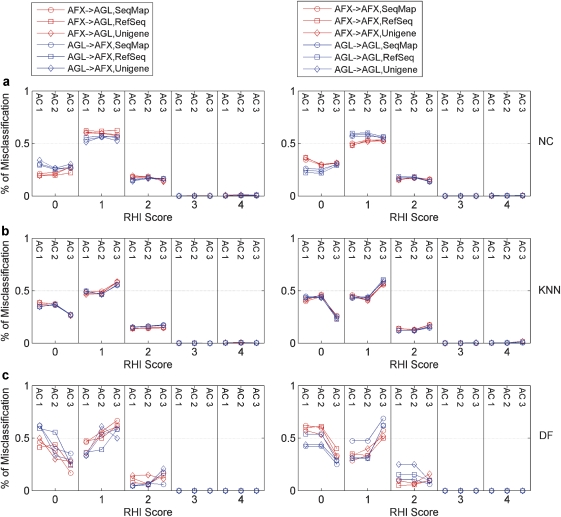
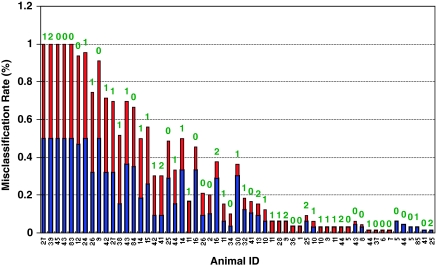
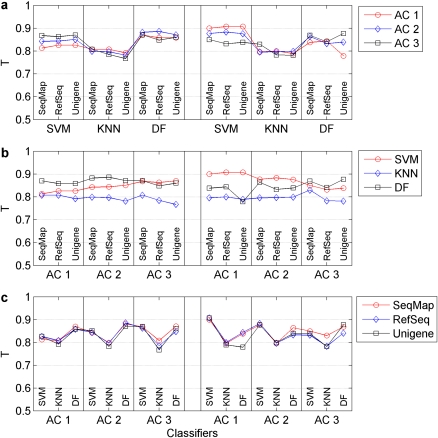
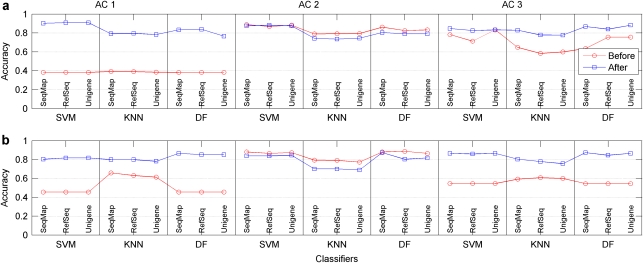
Microarray-based classifiers and associated signature genes generated from various platforms are abundantly reported in the literature; however, the utility of the classifiers and signature genes in cross-platform prediction applications remains largely uncertain. As part of the MicroArray Quality Control Phase II (MAQC-II) project, we show in this study 80-90% cross-platform prediction consistency using a large toxicogenomics data set by illustrating that: (1) the signature genes of a classifier generated from one platform can be directly applied to another platform to develop a predictive classifier; (2) a classifier developed using data generated from one platform can accurately predict samples that were profiled using a different platform. The results suggest the potential utility of using published signature genes in cross-platform applications and the possible adoption of the published classifiers for a variety of applications. The study reveals an opportunity for possible translation of biomarkers identified using microarrays to clinically validated non-array gene expression assays.


Figures

Figure 1
Figure 1
Two analysis procedures for evaluation of cross-platform consistency. (a) Transferability of signature genes was assessed by first developing Affymetrix-specific classifiers using the training set data. The signature genes used by the Affymetrix classifiers were then applied to the training set data generated using the Agilent platform in order to produce Agilent-specific classifiers. Both sets of platform-specific classifiers were then used to predict their own test sets, independently. The process was repeated such that the signature genes were initially identified on the Agilent platform and then applied to the Affymetrix platform. The prediction accuracy that was achieved with both platforms was used to assess the cross-platform consistency at the level of signature genes. (b) Transferability of classifiers is to assess whether a classifier generated from one platform can accurately predict the samples profiled by another platform. Specifically, a set of classifiers using the training set data was generated for a given platform. These classifiers were then used to predict the test set for both platforms, independently. This was examined bi-directionally for both of the microarray platforms. The difference in the prediction accuracy of the test sets from the two platforms was used to evaluate cross-platform consistency at the level of classifiers.
Figure 2
Figure 2
Assessment of transferability of signature genes across platform using T-index scores. A total of 54 permutations were tested to assess cross-platform transferability of signature genes, which consisted of two platforms, three ACs, three approaches for generating CT lists and three classification algorithms. A T-index score was calculated for each permutation to evaluate the transferability. (a) Compares the T-index scores that were generated by the three ACs, while (b) compares the results that were achieved with the three classification algorithms. (c) Depicts the T-index scores that were obtained with the three approaches for generating CT sets across the two platforms. Both AC and methods to select the CTs had little effect on the transferability while a degree of variability was observed for different classification algorithms.
Figure 3
Figure 3
Distribution of the percentage of misclassified samples across different ‘RHI' scores. Fifty-four classifiers (summarized in Figure 2 and Supplementary Table 1 online) were plotted in three panels based on the classification algorithm that was used: (a) nearest centriod (NC); (b) K-nearest neighbor (KNN); and (c) decision forest (DF). AFX AFX (or AGL AGL) denotes the prediction results to the test set that were obtained when the signature genes were generated using the Affymetrix (or Agilent) training set from the same platform. In contrast, AFX AGL (or AGL AFX) indicates that the signature genes had been identified using the training set from the opposite platform. No samples with an RHI score >2 was misclassified in any of the permutations tested. The largest misclassification rate was observed for low RHI scores (that is, RHI=0 and 1), relating to either the absence of any apparent or the presence of only minor amounts of liver injury.
Figure 4
Figure 4
The misclassification rate for each animal of the test set in the study of cross-platform transferability of signature genes. The study of cross-platform transferability of signature genes involved 54 permutations (that is, two microarray platforms × three ACs × three CT sets × three algorithms), resulting total of 108 classifiers (that is, transfer from Affymetrix to Agilent and vice versa). The misclassification rate is calculated by dividing the frequency of misclassification for each animal by the total number of classifiers (that is, 108 classifiers) for the test set. Each bar is divided into two colors; the blue is associated with the misclassification for the classifiers selected by the cross-validation while the red is for the classifiers using the transferred signature genes. The label above the bar is the RHI score. All the misclassified animals had the RHI scores of 0, 1 or 2, and no animals with RHI=3 and 4 were misclassified. the samples (that is, animals) misclassified by the cross-validation driven classifiers in one platform likely occurred in another platform using the transferred signature genes, indicating the performance of the classifiers was not affected by the choice of the signature genes as long as they were validated in any platform. Animals 27, 39, 45, 43 and 83 were misclassified by all the classifiers.
Figure 5
Figure 5
Assessment of transferability of classifiers across platform using T-index scores. A total of 54 permutations were tested to assess cross-platform predictivity of classifiers, which consisted of two platforms, three ACs, three approaches for generating CT sets and three classification algorithms (that is, support vector machine (SVM), KNN and DF). AFX AGL (or AGL AFX) denotes that the classifiers were generated from the Affymetrix (or Agilent) platform and then used to predict the test sets that profiled by the opposite platform. A T-index score was calculated for each permutation to evaluate the cross-platform predictivity based on a comparative analysis of prediction results obtained from both of the test sets that each set of classifiers was used to predict. (a) Compares the T-index scores that were generated by the three ACs, while (b) compares the results that were achieved with the three classification algorithms. (c) Depicts the T-index scores that were obtained with the three approaches for generating CT lists across the two platforms. The results indicate that the cross-platform predictivity was independent of the AC and the method for identifying the CTs, but varied slightly with the classification algorithms.
Figure 6
Figure 6
Assessment of cross-platform batch correction on the transferability of classifiers across platform. The effect of cross-platform batch correction was evaluated for each of the 54 permutations before and after the batch correction was applied to the data. (a) Compares the prediction accuracy that was obtained by generating classifiers using data from the Agilent platform and then predicting the test set data from the Affymetrix platform. (b) Depicts the results from the reverse approach in which the classifiers were generated using data from the Affymetrix platform and then used to predict the test set data from the Agilent platform. The results showed that cross-platform batch correction was necessary for ACs 1 and 3, but not required when the ratio data was used (AC 2).

Comment in

Similar articles

Cited by

References

    1. Schena M, Shalon D, Davis RW, Brown PO. Quantitative monitoring of gene expression patterns with a complementary DNA microarray. Science. 1995;270:467–470. - PubMed
    1. van de Vijver MJ, He YD, van't Veer LJ, Dai H, Hart AA, Voskuil DW, et al. A gene-expression signature as a predictor of survival in breast cancer. N Engl J Med. 2002;347:1999–2009. - PubMed
    1. Dumur CI, Lyons-Weiler M, Sciulli C, Garrett CT, Schrijver I, Holley TK, et al. Interlaboratory performance of a microarray-based gene expression test to determine tissue of origin in poorly differentiated and undifferentiated cancers. J Mol Diagn. 2008;10:67–77. - PMC - PubMed
    1. Yauk CL, Berndt ML. Review of the literature examining the correlation among DNA microarray technologies. Environ Mol Mutagen. 2007;48:380–394. - PMC - PubMed
    1. Bammler T, Beyer RP, Bhattacharya S, Boorman GA, Boyles A, Bradford BU, et al. Standardizing global gene expression analysis between laboratories and across platforms. Nat Methods. 2005;2:351–356. - PubMed

Publication types