Comparative Study
. 2010 Aug;10(4):278-91.
doi: 10.1038/tpj.2010.57.

A comparison of batch effect removal methods for enhancement of prediction performance using MAQC-II microarray gene expression data

Affiliations
Free PMC article
Comparative Study

A comparison of batch effect removal methods for enhancement of prediction performance using MAQC-II microarray gene expression data

J Luo et al. Pharmacogenomics J. 2010 Aug.
Free PMC article

Abstract

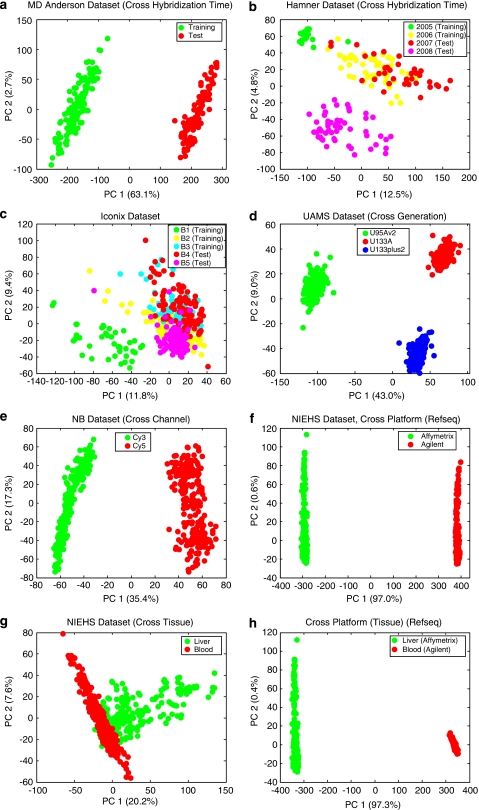
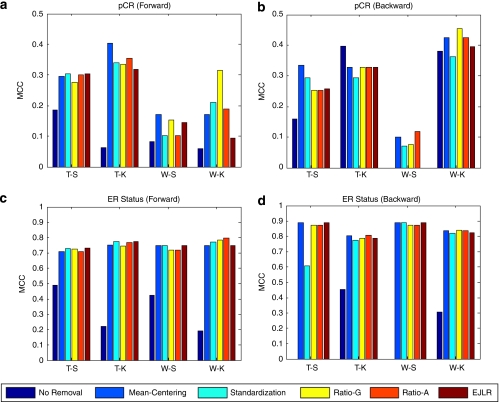
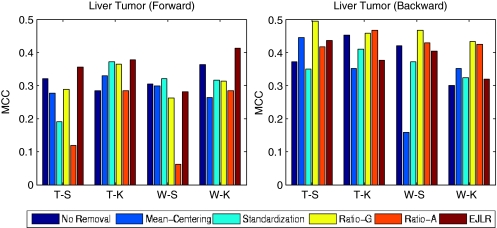
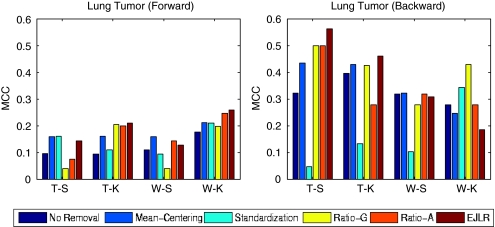
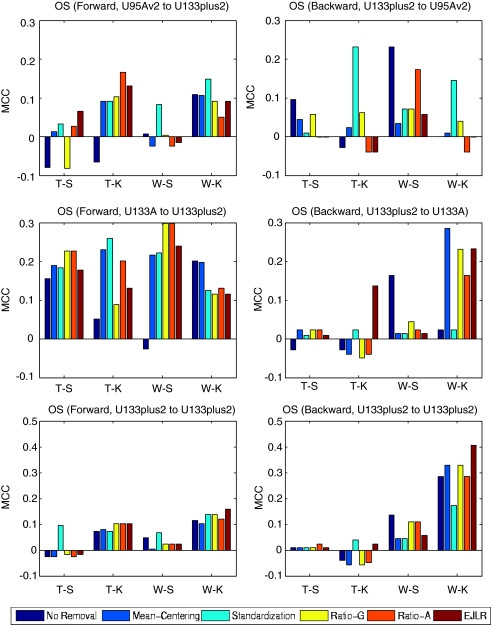
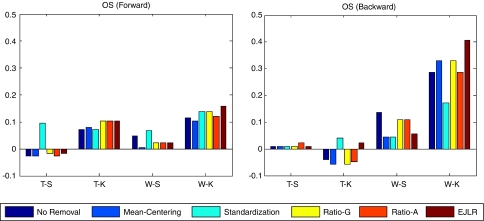
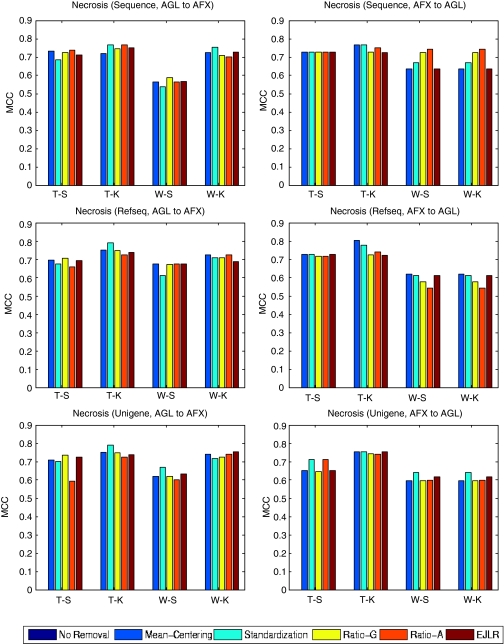
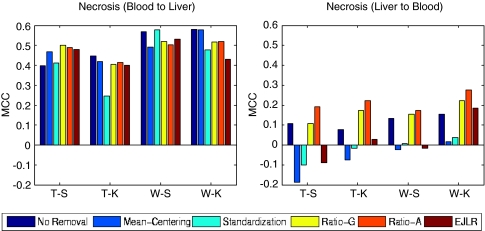
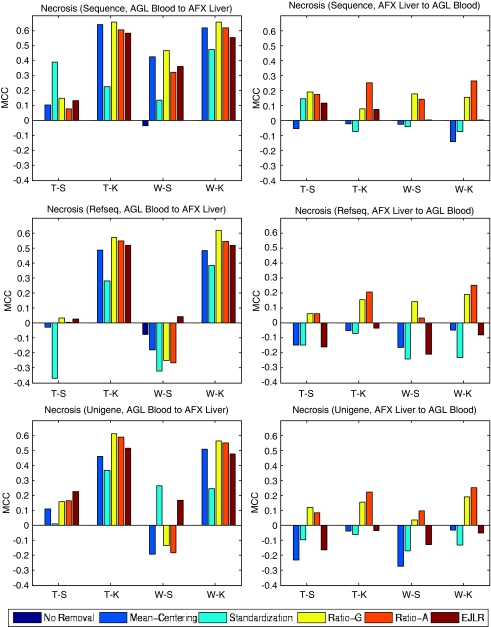
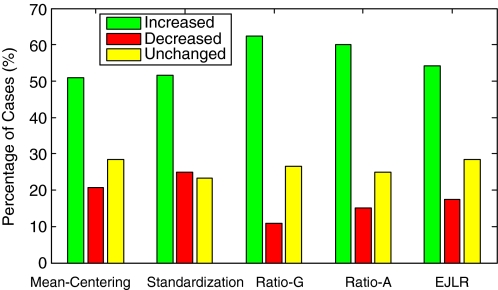
Batch effects are the systematic non-biological differences between batches (groups) of samples in microarray experiments due to various causes such as differences in sample preparation and hybridization protocols. Previous work focused mainly on the development of methods for effective batch effects removal. However, their impact on cross-batch prediction performance, which is one of the most important goals in microarray-based applications, has not been addressed. This paper uses a broad selection of data sets from the Microarray Quality Control Phase II (MAQC-II) effort, generated on three microarray platforms with different causes of batch effects to assess the efficacy of their removal. Two data sets from cross-tissue and cross-platform experiments are also included. Of the 120 cases studied using Support vector machines (SVM) and K nearest neighbors (KNN) as classifiers and Matthews correlation coefficient (MCC) as performance metric, we find that Ratio-G, Ratio-A, EJLR, mean-centering and standardization methods perform better or equivalent to no batch effect removal in 89, 85, 83, 79 and 75% of the cases, respectively, suggesting that the application of these methods is generally advisable and ratio-based methods are preferred.


Figures

Figure 1
Figure 1
Score plot of the first two principal components for the eight scenarios. Batches (groups) are indicated by colors. (a) MD Anderson breast cancer data set. (b) Hamner lung carcinogen data set (two batches in training set hybridized in 2005 and 2006, and two batches in test set hybridized in 2007 and 2008). (c) Iconix liver tumor data set (three batches in training set and two in test set). (d) UAMS multiple myeloma data set (the three batches represent three generations of Affymetrix chips on Homo Sapiens). (e) Cologne neuroblastoma data set (the two batches represent the two channels of Agilent arrays). (f) NIEHS data set (cross-platform: the two groups represent Affymetrix and Agilent microarray platforms. For brevity, PCA is performed for common genes with Refseq mapping only. The plots for common genes with Unigene and Sequence mappings are similar). (g) NIEHS data set (cross-tissue: the two groups represent liver and blood samples profiled on Agilent array). (h) NIEHS data set (cross-tissue-and-cross-platform: the two groups represent liver samples profiled on Affymetrix arrays and blood samples profiled on Agilent arrays).
Figure 2
Figure 2
Forward and backward cross-batch prediction performance (y axis) in terms of MCC with different combinations of feature selection and classification algorithm (x axis). (ab) MD Anderson breast cancer dataset (endpoint: pCR, batch effect cause: different hybridization dates); (cd) MD Anderson breast cancer data set (endpoint: estrogen receptor status, batch effect cause: different hybridization dates).
Figure 3
Figure 3
Forward and backward cross-batch prediction performance (y axis) in terms of MCC with different combinations of feature selection and classification algorithm (x axis). Iconix data set (endpoint: liver tumor, batch effect cause: different hybridization dates).
Figure 4
Figure 4
Forward and backward cross-batch prediction performance (y axis) in terms of MCC with different combinations of feature selection and classification algorithm (x axis). Hamner data set (endpoint: lung tumor, batch effect cause: different hybridization dates).
Figure 5
Figure 5
Forward and backward cross-batch prediction performance (y axis) in terms of MCC with different combinations of feature selection and classification algorithm (x axis). UAMS data set (endpoint: OS, batch effect cause: different generations of chips).
Figure 6
Figure 6
Forward and backward cross-batch prediction performance (y axis) in terms of MCC with different combinations of feature selection and classification algorithm (x axis). Cologne data set, endpoint: OS, batch effect cause: different channels).
Figure 7
Figure 7
Forward and backward cross-batch prediction performance (y axis) in terms of MCC with different combinations of feature selection and classification algorithm (x axis). NIEHS data set, endpoint: Necrosis, batch effect cause: different microarray platforms).
Figure 8
Figure 8
Forward and backward cross-batch prediction performance (y axis) in terms of MCC with different combinations of feature selection and classification algorithm (x axis) (NIEHS data set, endpoint: Necrosis, batch effect cause: different tissues).
Figure 9
Figure 9
Forward and backward cross-batch prediction performance (y axis) in terms of MCC with different combinations of feature selection and classification algorithm (x axis) (NIEHS data set, endpoint: Necrosis, batch effect cause: Different microarray platforms and different tissues).
Figure 10
Figure 10
Percentages of increased, decreased and unchanged cases in prediction performance after applying different batch effect removal methods. The total number of cases explored is 120.

References

    1. Affymetrix Microarray Suite User GuideVersion 5. Affymetrix2001
    1. Irizarry RA, Hobbs B, Collin F, Beazer-barclay YD, Antonellis KJ, Scherf U, et al. Exploration, normalization, and summaries of high density oligonucleotide array probe level data. Biostatistics. 2003;4:249–264. - PubMed
    1. Li C, Wing H.DNA-Chip Analyzer (dChip). The analysis of gene expression data: methods and softwareG Parmigiani, ES Garrett, R Irizarry and SL Zeger (eds).Springer, New York; 2003120–141.
    1. Yang Y, Dudoit S, Luu P, Lin DM, Peng V, Ngai J, et al. Normalization for cDNA microarray data: a robust composite method addressing single and multiple slide systematic variation. Nucleic Acids Res. 2002;30:e15. - PMC - PubMed
    1. Shi L, Campbell G, Jones W, Campagne F, Walker S, Su Z, et al. MAQC-II Project: a comprehensive study of common practices for the development and validation of microarray-based predictive modelsSubmitted toNat Biotechnol 2010 - PMC - PubMed

Publication types

Substances