Comparative Study
. 2010 Aug;10(4):292-309.
doi: 10.1038/tpj.2010.56.

k-Nearest neighbor models for microarray gene expression analysis and clinical outcome prediction

Affiliations
Free PMC article
Comparative Study

k-Nearest neighbor models for microarray gene expression analysis and clinical outcome prediction

R M Parry et al. Pharmacogenomics J. 2010 Aug.
Free PMC article

Abstract

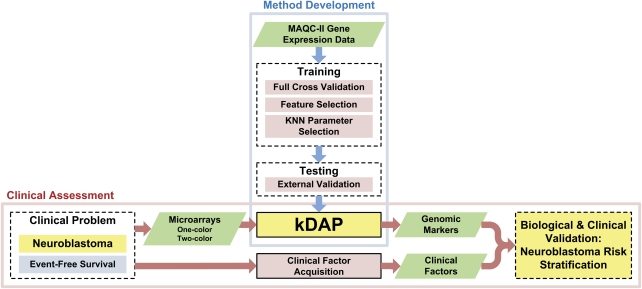
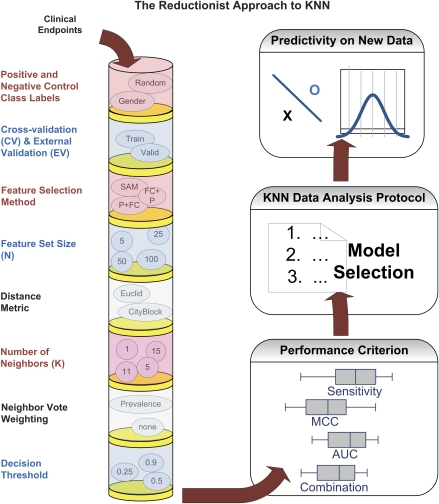
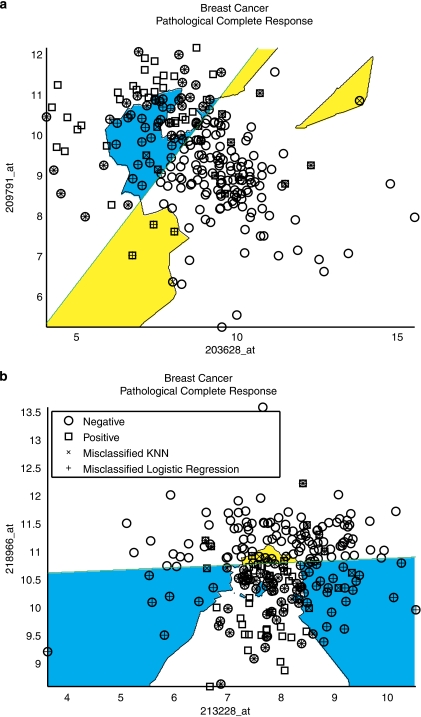
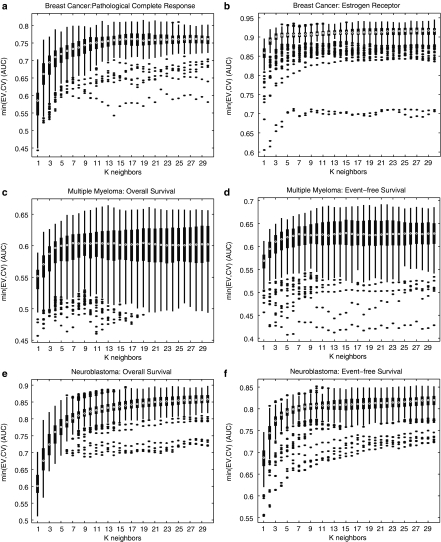
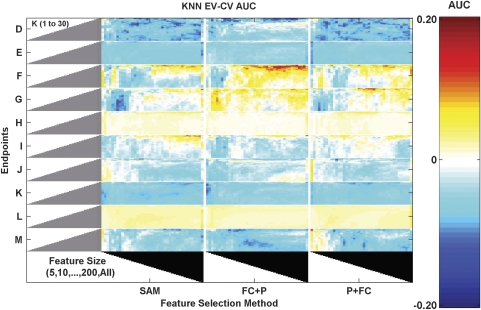
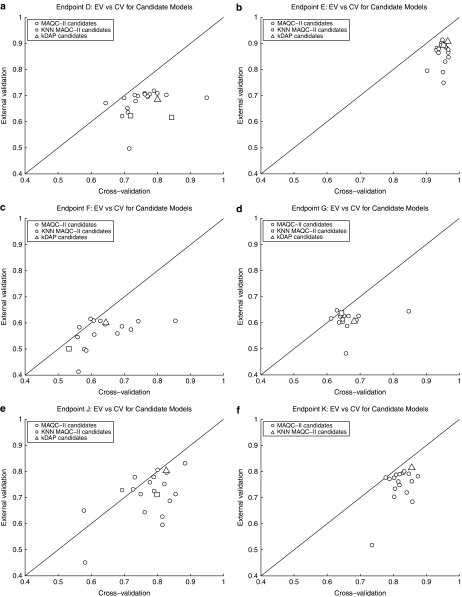
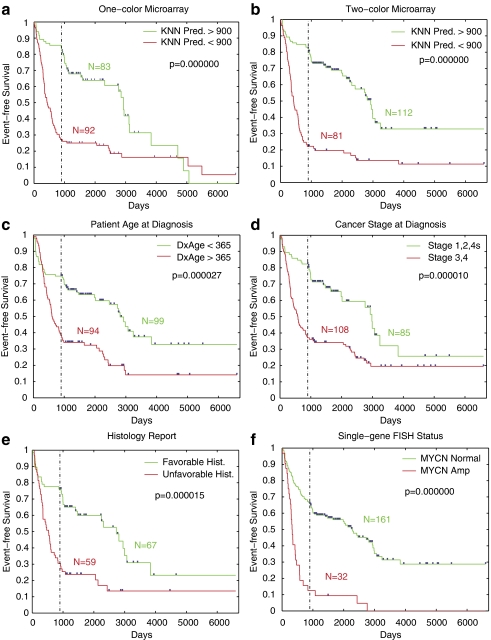
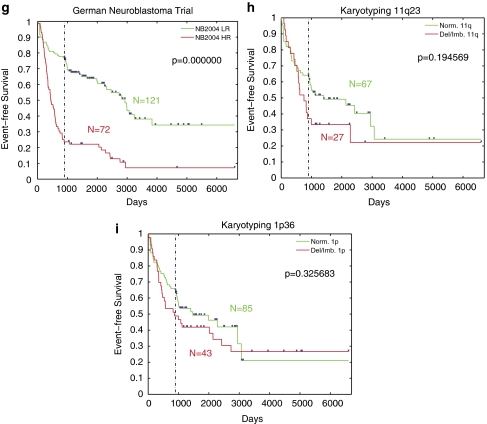
In the clinical application of genomic data analysis and modeling, a number of factors contribute to the performance of disease classification and clinical outcome prediction. This study focuses on the k-nearest neighbor (KNN) modeling strategy and its clinical use. Although KNN is simple and clinically appealing, large performance variations were found among experienced data analysis teams in the MicroArray Quality Control Phase II (MAQC-II) project. For clinical end points and controls from breast cancer, neuroblastoma and multiple myeloma, we systematically generated 463,320 KNN models by varying feature ranking method, number of features, distance metric, number of neighbors, vote weighting and decision threshold. We identified factors that contribute to the MAQC-II project performance variation, and validated a KNN data analysis protocol using a newly generated clinical data set with 478 neuroblastoma patients. We interpreted the biological and practical significance of the derived KNN models, and compared their performance with existing clinical factors.


Figures

Figure 1
Figure 1
Neuroblastoma case study to show clinical applications of KNN classifier. We designed a method to test whether KNN produces classifiers of good clinical relevance. First, we developed our approach using MAQC-II gene expression data. Then, we applied this approach to additional Neuroblastoma data and compared it to existing clinical factors for risk.
Figure 2
Figure 2
Generalized workflow for the systematic KNN analysis. The factors shown in black were found to have very little contribution to performance variance. Representative values of each factor in the column indicate that the complete analysis of all factors (varying only one factor for each model) allows for accurate separation of the influence of each factor (for the purposes of ANOVA analysis).
Figure 3
Figure 3
Feature space comparison of a linear and nonlinear classifier on (a) genes that perform well individually and (b) genes that only perform well together. The straight line that separates the white+blue region from the white+yellow region represents the logistic regression decision boundary. KNN provides a curved decision boundary that disagrees with logistic regression in the blue and yellow regions.
Figure 4
Figure 4
Number of neighbors affects cross-validation performance for end points D, E, F, G, J, and K in subparts (a), (b), (c), (d), (e), and (f), respectively. Box plots represent the distribution of predictable performance (i.e., Min(CV,EV)) for the population of models with varying k using AUC. For each box plot, a white circle indicates the median; the black box joins the 25th and 75th percentiles and black dots indicate outliers. High medians with small range are desirable.
Figure 5
Figure 5
No single set of parameters perform reproducibly for all end points. The reproducibility of model performance is quantitatively measured as the percent change of external validation (EV) from internal cross validation (CV). Across the KNN parameter space (including k, feature ranking method and number of features with a decision threshold of 0.5), the difference between EV and CV AUC ranges from +20 to −20%, with distinct regions of higher or lower EV performance relative to CV. Reproducible models are the white regions of the heat map, indicating very small differences between EV and CV. Overall, no single set of KNN parameters performs well for all end points.
Figure 6
Figure 6
KNN data analysis protocol compared to MAQC-II candidate models for end points D, E, F, G, J, and K in subparts (a), (b), (c), (d), (e), and (f), respectively. Scatter plots show external validation versus cross-validation performance for the proposed kDAP model (triangle), other MAQC-II candidate KNN models (square) and other (non-KNN) MAQC-II candidate models (circle).
Figure 7
Figure 7
Comparison of KNN prediction of neuroblastoma event-free survival to established clinical factors for risk stratification. Kaplan–Meier plots compare the prognostic accuracy of the kDAP model on (a) two-color data set and (b) one-color data set compared with several clinical factors: (c) age of the patient at diagnosis, (d) stage of the disease at diagnosis, (e) favorable or unfavorable histology using the Shimada system, (f) MYCN amplification, (g) risk stratification from the German Neuroblastoma Trials (intermediate-risk (IR) patients were grouped with low-risk (LR) patients), (h) the status of chromosome 11q23 and (i) the status of chromosome 1p36.
Figure 7
Figure 7
Comparison of KNN prediction of neuroblastoma event-free survival to established clinical factors for risk stratification. Kaplan–Meier plots compare the prognostic accuracy of the kDAP model on (a) two-color data set and (b) one-color data set compared with several clinical factors: (c) age of the patient at diagnosis, (d) stage of the disease at diagnosis, (e) favorable or unfavorable histology using the Shimada system, (f) MYCN amplification, (g) risk stratification from the German Neuroblastoma Trials (intermediate-risk (IR) patients were grouped with low-risk (LR) patients), (h) the status of chromosome 11q23 and (i) the status of chromosome 1p36.

References

    1. Shi L.MAQC-II Project: a comprehensive survey of common practices for the development and validation of microarray-based predictive models Nat Biotechnol 2010. advance online publication, doi:10.1038/nbt.1665 - DOI - PMC - PubMed
    1. Gong Y, Yan K, Lin F, Anderson K, Sotiriou C, Andre F, et al. Determination of oestrogen-receptor status and ERBB2 status of breast carcinoma: a gene-expression profiling study. Lancet Oncol. 2007;8:203–211. - PubMed
    1. Shaughnessy JD, Jr, Zhan F, Burington BE, Huang Y, Colla S, Hanamura I, et al. A validated gene expression model of high-risk multiple myeloma is defined by deregulated expression of genes mapping to chromosome 1. Blood. 2007;109:2276–2284. - PubMed
    1. Oberthuer A, Berthold F, Warnat P, Hero B, Kahlert Y, Spitz R, et al. Customized oligonucleotide microarray gene expression-based classification of neuroblastoma patients outperforms current clinical risk stratification. J Clin Oncol. 2006;24:5070–5078. - PubMed
    1. Dudoit S, Fridlyand J, Speed TP. Comparison of discrimination methods for the classification of tumors using gene expression data. J Am Stat Assoc. 2002;97:77–87.

Publication types

MeSH terms

Substances