. 2010 Sep;11(9):846-53.
doi: 10.1038/ni.1915. Epub 2010 Aug 1.

Activation of the aryl hydrocarbon receptor induces human type 1 regulatory T cell-like and Foxp3(+) regulatory T cells

Affiliations

Activation of the aryl hydrocarbon receptor induces human type 1 regulatory T cell-like and Foxp3(+) regulatory T cells

Roopali Gandhi et al. Nat Immunol. 2010 Sep.

Abstract

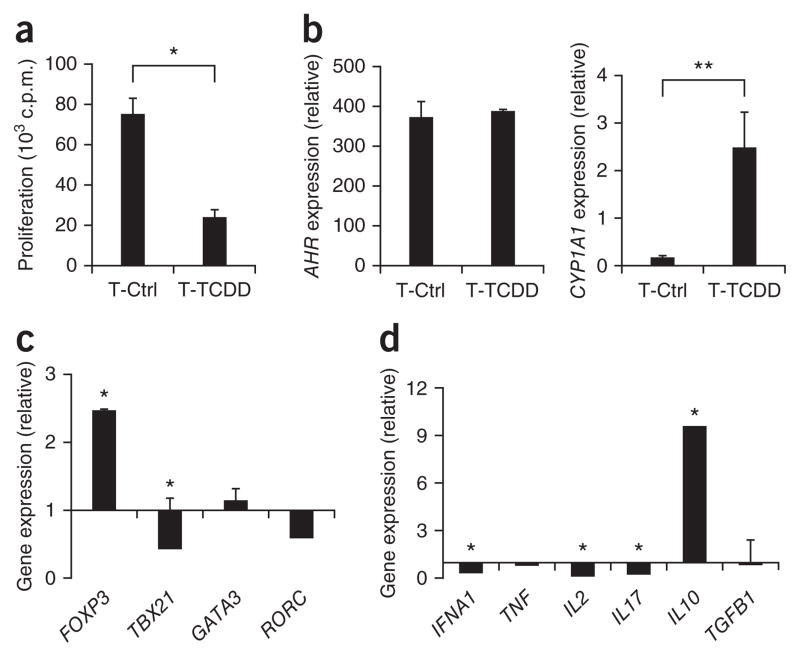
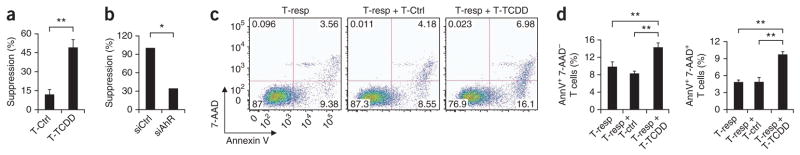
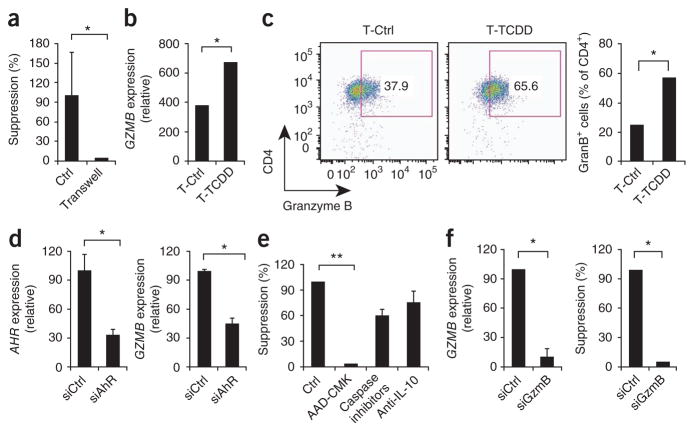
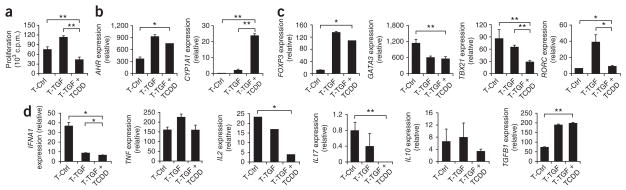
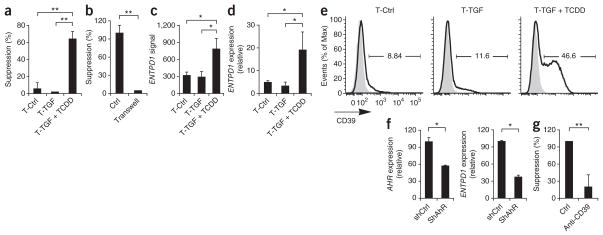
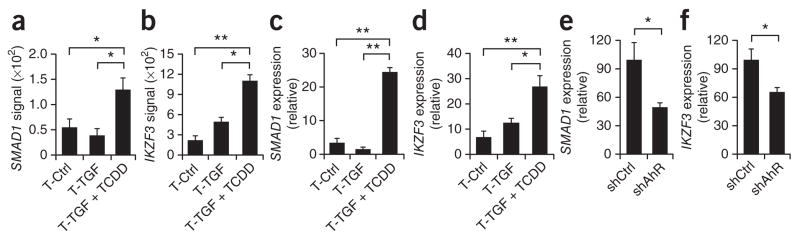
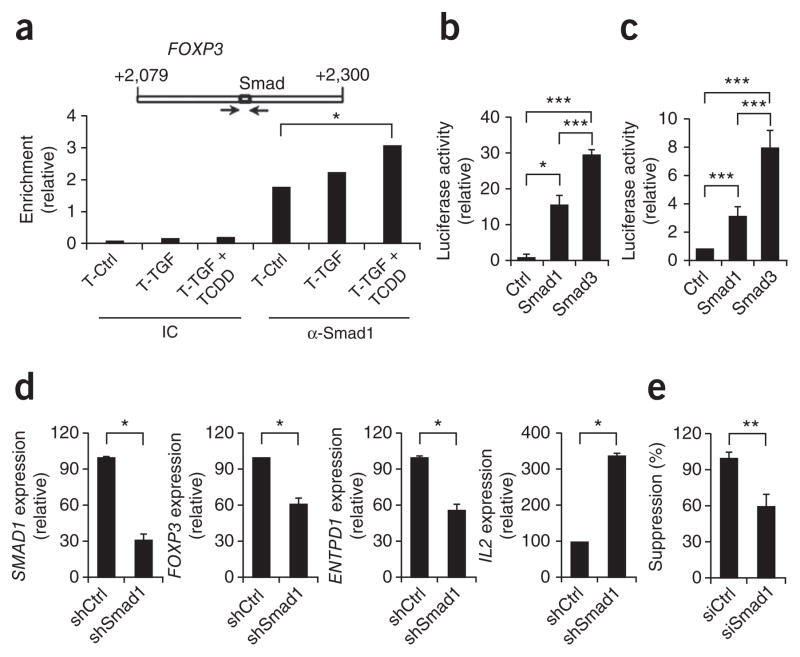
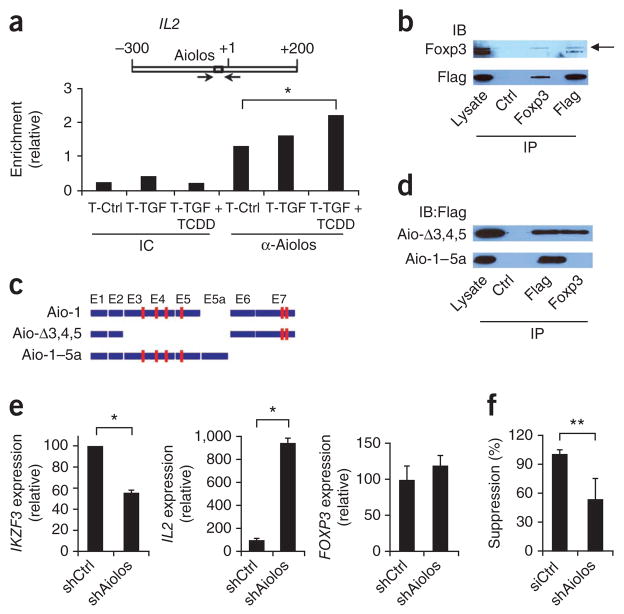
The aryl hydrocarbon receptor (AhR) participates in the differentiation of mouse regulatory T cells (T(reg) cells) and interleukin 17 (IL-17)-producing helper T cells (T(H)17 cells), but its role in human T cell differentiation is unknown. We investigated the role of AhR in the differentiation of human induced T(reg) cells (iT(reg) cells). We found that AhR activation promoted the differentiation of CD4(+)Foxp3(-) T cells, which produce IL-10 and control responder T cells through granzyme B. However, activation of AhR in the presence of transforming growth factor-beta1 induced Foxp3(+) iT(reg) cells, which suppress responder T cells through the ectonucleoside triphosphate diphosphohydrolase CD39. The induction of functional Foxp3(+) iT(reg) cells required coordinated action of the transcriptional regulators Smad1 and Aiolos. Thus, AhR is a potential target through which functional iT(reg) cells could be induced in human autoimmune disorders.


Conflict of interest statement

COMPETING FINANCIAL INTERESTS

The authors declare no competing financial interests.

Figures

Figure 1
Figure 1
AhR activation induces T cells that produce IL-10. (a) Proliferative response of human naive CD4+ T cells activated for 6 d with plate-bound anti-CD3 and anti-CD28, with (T-TCDD) or without (T-Ctrl) TCDD, then restimulated with bead-conjugated anti-CD3 and anti-CD28. (bd) Real-time PCR analysis of the expression of AHR and the AhR target CYP1A1 (b), FOXP3, TBX21, GATA3 and RORC (c) and cytokines (d) on differentiated T cells (only TCDD-treated cells in c,d); results are presented relative to the expression of GAPDH (encoding glyceraldehyde phosphate dehydrogenase; bd) and as the ratio of expression in T-TCDD cells to that in T-Ctrl cells (c,d). *P < 0.05 and **P < 0.01, compared with T-Ctrl (Student’s t-test). Data are representative of five experiments (a; mean + s.d. of triplicate wells) or represent one of three to five independent experiments (bd; mean + s.d. of duplicates).
Figure 2
Figure 2
AhR activation induces human Tr1-like cells. (a) Suppressive activity of human naive CD4+ T cells activated for 6 d with plate-bound anti-CD3 and soluble anti-CD28, with or without TCDD. (b) Effect of AHR knockdown on the suppressive activity of TCDD-treated T cells transduced with non–target-specific control siRNA (siCtrl) or AHR-specific siRNA (siAhR). (c) Flow cytometry of annexin V and 7-AAD in responder human CD4+ T cells (T-resp) coincubated with T cells with or without TCDD treatment. Numbers in quadrants indicate percent cells in each. (d) Frequency of annexin V–positive (AnnV+), 7-AAD T cells (left) and annexin V–positive, 7-AAD+ T cells (right) in the cocultures in c. *P < 0.05 and **P < 0.01, compared with T-Ctrl (Student’s t-test). Data are representative of five experiments (a; mean + s.d. of triplicate wells), two experiments (b), three to eight independent experiments (c) or three independent experiments (d; mean + s.d.).
Figure 3
Figure 3
The suppressive activity of Tr1-like cells induced by AhR activation is mediated by granzyme B. (a) Suppressive activity of human naive CD4+ T cells activated with plate-bound anti-CD3 and soluble anti-CD28, with TCDD, and incubated in contact with responder T cells (Ctrl) or with a Transwell (Transwell). (b) Quantitative real-time PCR analysis of GZMB expression on T cells with or without TCDD, presented relative to GAPDH expression. (c) Flow cytometry of granzyme B expression on T cells with or without TCDD. Numbers in outlined areas (left) indicate percent CD4+ granzyme B–positive (GranB+) cells. (d) Expression of AHR (left) and GZMB (right) in TCDD-treated cells transduced with nonspecific control or AHR-specific siRNA, presented relative to GAPDH expression. (e) Suppressive activity of TCDD-treated T cells left unstimulated or treated with the granzyme B inhibitor AAD-CMK, caspase inhibitors or neutralizing anti-IL-10. (f) GZMB expression (left) and the suppressive activity (right) of TCDD-treated T cells transduced with control siRNA or GNZB-specific siRNA (siGnzB). *P < 0.05 and **P < 0.01, compared with T-Ctrl (b,c), siCtrl (d,f) or no treatment (e; Student’s t-test). Data are representative of two experiments (a,d,f; mean + s.d. of triplicate wells in a and mean + s.d. in d,f), four experiments (b,c; mean + s.d. of duplicates (b) or mean (right, c) or three experiments (e; mean + s.d.).
Figure 4
Figure 4
AhR activation plus TGF-β1 induces Foxp3+ T cells. (a) Proliferative response of human naive CD4+ T cells activated for 6 d with plate-bound anti-CD3 and soluble anti-CD28 alone (T-Ctrl) or together with TGF-β1 alone (T-TGF) or TGF-β1 plus TCDD (T-TGF + TCDD) and restimulated with bead-conjugated anti-CD3 and anti-CD28. (bd) Expression of AHR and CYP1A1 (b), FOXP3, GATA3, TBX21 and RORC (c) and cytokines (d) on cells treated as described in a; results are presented relative to GAPDH expression. *P < 0.05 and **P < 0.01, compared with T-Ctrl or T-TGF (Student’s t-test). Data are representative of five experiments (a; mean + s.d. of triplicate wells) or three to five experiments (bd; mean + s.d. of duplicates).
Figure 5
Figure 5
AhR activation plus TGF-β1 induces functional human Foxp3+ Treg cells. (a) Suppressive activity of human naive CD4+ T cells activated with plate-bound anti-CD3 and anti-CD28 alone or together with TGF-β1 alone or TGF-β1 plus TCDD (as in Fig. 4a). (b) Suppressive activity of T cells activated with plate-bound anti-CD3 and anti-CD28 alone together with TGF-β1 plus TCDD, incubated in contact with responder T cells (control (Ctrl)) or in a Transwell system (Transwell). (c,d) Gene microarray analysis (c) and quantitative PCR analysis (d) of ENTPD1 expression on cells treated as described in a; results in d are presented relative to GAPDH expression. (e) Flow cytometry of CD39 (ENTPD1) expression (dark lines) on cells treated as described in a; gray filled histograms, isotype-matched control antibody. Numbers above bracketed lines indicate percent CD39+ cells. (f) Expression of AHR (left) and ENTPD1 (right) in T cells as described in a transduced with nonspecific control or AHR-specific siRNA, presented relative to GAPDH expression. (g) Suppressive activity of cells activated as described in b and treated with control antibody or anti-CD39. *P < 0.05 and **P < 0.01, compared with T-Ctrl or T-TGF (a,c,d), shCtrl (f,g) or no Transwell (b; Student’s t-test). Data are representative of five (a,d), two (b,f) or three (e) experiments (mean and s.d. in ad) or three (c) or five (g) independent experiments (mean and s.d. of all).
Figure 6
Figure 6
AhR activation plus TGF-β1 induce the expression of Smad1 and Aiolos. (a,b) Gene microarray analysis of the expression of SMAD1 (a) and IKZF3 (Aiolos; b) by human naive CD4+ T cells activated for 6 d with plate-bound anti-CD3 and soluble anti-CD28 alone or together with TGF-β1 alone or TGF-β1 plus TCDD (as in Fig. 4a). (c,d) Quantitative real-time PCR analysis of the expression of SMAD1 (c) and IKZF3 (d) on cells treated as described in a,b, presented relative to GAPDH expression. (e,f) Expression of SMAD1 (e) and IKZF3 (f) by human naive CD4+ T cells activated for 6 d with plate-bound anti-CD3 and soluble anti-CD28 together with TGF-β1 plus TCDD and transduced with nonspecific control or AHR-specific shRNA, presented relative to GAPDH expression. *P < 0.05 and **P < 0.01, compared with T-Ctrl or T-TGF (ad) or shCtrl (e,f; Student’s t-test). Data are representative of three independent experiments (a,b; mean and s.d. of all) or five (c,d) or two (e,f) experiments (mean and s.d.).
Figure 7
Figure 7
Smad1 regulates FOXP3 enhancer activity. (a) Smad-binding site in the FOXP3 enhancer (top) and ChIP analysis (below) of the interaction of Smad1 with that binding site in human naive CD4+ T cells activated with plate-bound anti-CD3 and soluble anti-CD28 alone or together with TGF-β1 alone or TGF-β1 plus TCDD (as in Fig. 4a), precipitated with isotype-matched control antibody (IC) or anti-Smad1 (α-Smad1); results are presented as enrichment relative to input chromatin. (b) Luciferase activity in EL4 cells transfected with a reporter containing six copies of the Smad-binding motif in the FOXP3 enhancer together with empty control vector (Ctrl) or vector encoding Smad1 or Smad3, and activated in the presence of TGF-β1 (ref. 33); results are presented relative to renilla luciferase. (c) Luciferase activity in EL4 cells transfected with a reporter for the FOXP3 enhancer shown in a, together with empty control vector or vector encoding Smad1 or Smad3, and activated in the presence of TGF-β1; results are presented relative to renilla luciferase. (d) Expression of SMAD1, FOXP3, ENTPD1 and IL2 by human naive CD4+ T cells activated with plate-bound anti-CD3 and soluble anti-CD28 together with TGF-β1 plus TCDD and transduced with nonspecific control shRNA (shCtrl) or SMAD1-specific shRNA (shSmad1), presented relative to GAPDH expression. (e) Suppressive activity of cells activated and transduced as described in d. *P < 0.05, **P < 0.01 and ***P < 0.001, compared with T-Ctrl (a), Ctrl or Smad1 (b,c), shCtrl (d) or siCtrl (e; Student’s t-test). Data are representative of three (ac) or two (d,e) experiments (mean and s.d.).
Figure 8
Figure 8
Aiolos interacts with Foxp3 to silence IL2 expression. (a) Aiolos-binding site in the IL2 promoter (top) and ChIP analysis (below) of the interaction between Aiolos and that binding site in the IL2 promoter in human naive CD4+ T cells activated for 6 d with plate-bound anti-CD3 and soluble anti-CD28 alone or together with TGF-β1 alone or TGF-β1 plus TCDD (as in Fig. 4a), precipitated with isotype-matched control antibody (IC) or anti-Aiolos (α-Aiolos). (b) Physical interaction between Aiolos and Foxp3 in 293 human embryonic kidney cells transfected with constructs encoding Foxp3 and Flag-tagged Aiolos and lysed 24 h later, followed by immunoprecipitation (IP) with isotype-matched control antibody (Ctrl), anti-Foxp3 or anti-Flag, and analysis by immunoblot (IB) with anti-Foxp3 or anti-Flag. Arrow indicates Foxp3. Lysate, immunoblot analysis before immunoprecipitation. (c) Aiolos isoforms. Red boxes indicate zinc-finger motifs; E1–E7 indicate exons 1–7. (d) Immunoassay of 293 cells transfected with constructs encoding Foxp3 or Flag-tagged isoforms of Aiolos and lysed 48 h later, followed by immunoprecipitation with isotype-matched control antibody, anti-Foxp3 or anti-Flag, and analysis by immunoblot with anti-Flag. (e) Expression of IKZF3, IL2 and FOXP3 by human naive CD4+ T cells activated with plate-bound anti-CD3 and soluble anti-CD28 together with TGF-β1 plus TCDD and transduced with nonspecific control shRNA (shCtrl) or IKZF3-specific shRNA (shAiolos), presented relative to GAPDH expression. (f) Suppressive activity of cells activated and transduced as described in e. *P < 0.05 and **P < 0.01, compared with T-Ctrl (a), shCtrl (e) or siCtrl (f; Student’s t-test). Data are representative of three (a,b,d) or two (e,f) experiments (mean and s.d. in a,e,f).

Comment in

References

    1. Sakaguchi S. Naturally arising CD4+ regulatory T cells for immunologic self-tolerance and negative control of immune responses. Annu Rev Immunol. 2004;22:531–562. - PubMed
    1. Fontenot JD, Gavin MA, Rudensky AY. Foxp3 programs the development and function of CD4+CD25+ regulatory T cells. Nat Immunol. 2003;4:330–336. - PubMed
    1. Hori S, Nomura T, Sakaguchi S. Control of regulatory T cell development by the transcription factor Foxp3. Science. 2003;299:1057–1061. - PubMed
    1. Chen W, et al. Conversion of peripheral CD4+CD25− naive T cells to CD4+CD25+ regulatory T cells by TGF-β induction of transcription factor Foxp3. J Exp Med. 2003;198:1875–1886. - PMC - PubMed
    1. Allan SE, et al. Activation-induced FOXP3 in human T effector cells does not suppress proliferation or cytokine production. Int Immunol. 2007;19:345–354. - PubMed

Publication types

MeSH terms