. 2010 Aug;17(8):1019-23.
doi: 10.1038/nsmb.1865. Epub 2010 Aug 1.

Novel insights into K+ selectivity from high-resolution structures of an open K+ channel pore

Affiliations

Novel insights into K+ selectivity from high-resolution structures of an open K+ channel pore

Sheng Ye et al. Nat Struct Mol Biol. 2010 Aug.

Abstract

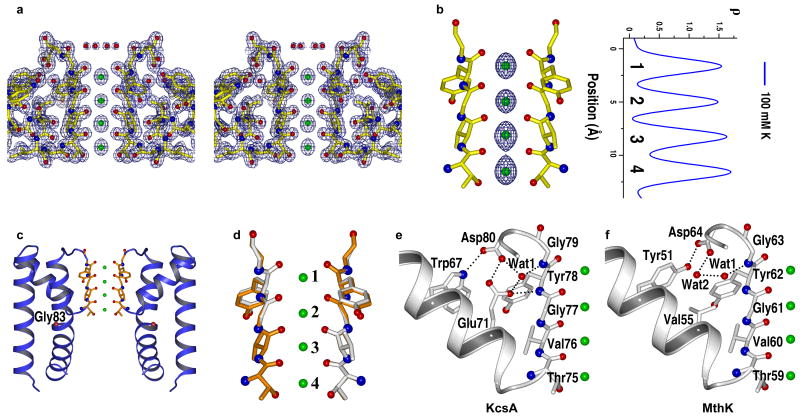
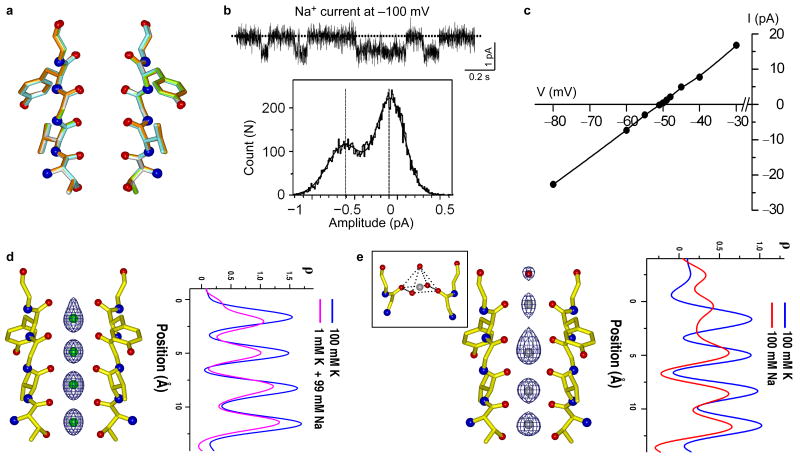
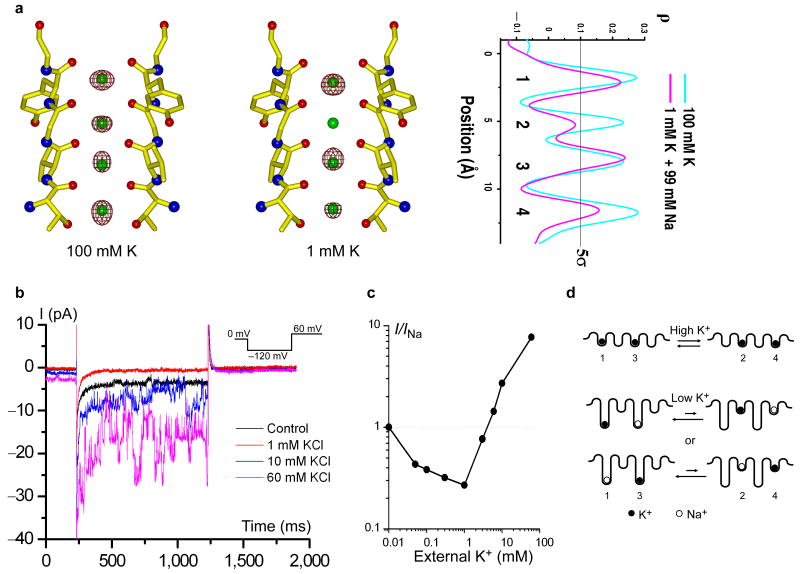
K+ channels are highly selective for K+ over Na+. Here we present several crystal structures of the MthK K+ channel pore at up to 1.45-A resolution. The MthK selectivity filter maintains a conductive conformation even in the absence of K+, allowing the channel to conduct Na+. The high-resolution structures, along with single-channel recordings, allow for an accurate analysis of how K+ competes with Na+ in a conductive selectivity filter. At high K+ concentrations, two K+ ions equivalently occupy the four sites in the selectivity filter, whereas at low K+/high Na+ concentrations, a single K+ ion remains bound in the selectivity filter, preferably at site 1 or site 3. This single K+ binding at low concentration effectively blocks the permeation of Na+, providing a structural basis for the anomalous mole-fraction effect, a key property of multi-ion pores.


Conflict of interest statement

Competing interests statement. The authors declared no competing interests.

Figures

Figure 1
Figure 1
Structure of open MthK pore in complex with K+ (in 100 mM K+). (a) Stereo view of 2Fo-Fc map (1 σ) at the selectivity filter region. K+ ions are modeled as green spheres. Only two diagonally opposite subunits are shown for clarity. (b) Fo-Fc ion omit map (5 σ) of K+ complex and its 1-D electron density profile along the central axis of the selectivity filter. The ion binding sites are numbered 1 to 4 from the extracellular to intracellular side. (c) Ribbon representation of the overall structure of the MthK pore in an open conformation. The red sphere in the inner helix indicates the position of the Cα atom of glycine gating hinge (Gly83). (d) Superimposition of the selectivity filter of MthK (grey) and KcsA (gold, PDB code 1K4C). (e & f) Comparison of the hydrogen bonding network surrounding the selectivity filter between KcsA (e) and MthK (f). Only the pore helix and the selectivity filter from one subunit are shown.
Figure 2
Figure 2
The selectivity filter of MthK maintains a conductive conformation in low K+ or Na+ only environment. (a) Superimposition of the MthK selectivity filter structures in the presence of 100 mM K+ (gold), 1 mM K+/99 mM Na+ (green) and 100 mM Na+ (cyan). (b) Single channel trace (upper panel) and histogram (lower panel) of Na+ conduction in MthK at -100 mV in the absence of K+. (c) Reverse potential of MthK measured with 100 mM KCl / 170 mM NaCl on the intracellular side and 10 mM KCl / 260 mM NaCl on the extracellular side. (d) Fo-Fc ion omit map (5 σ) of low-K+ complex (in 1 mM K+ / 99 mM Na+) and its 1-D electron density profile (pink) along the central axis of the selectivity filter. The 1-D electron density profile of K+ complex is also shown in blue for comparison. (e) Fo-Fc ion omit map (5 σ) of Na+-complex (in 100 mM Na+) and its 1-D electron density profile (red) along the central axis of the selectivity filter. The inset shows the pyramidal Na+ ion chelation at site 1.
Figure 3
Figure 3
K+ binding in the selectivity filter at high and low concentrations. (a) Anomalous difference Fourier maps (5 σ) of K+ (in 100 mM K+) and low-K+ (in 1 mM K+/99mM Na+) complexes of MthK pores and their 1-D electron density profiles at the selectivity filter region. (b) Inward currents of MthK recorded at -120 mV in the presence of various extracellular K+ concentrations. Both sides contain 170 mM NaCl. The control trace was recorded in the absence of extracellular K+. (c) Magnitude of inward current as a function of extracellular K+ concentration. Data points were obtained from an ensemble of 20 traces at each [K+]. Currents were normalized to the control trace (0 mM K+). (d) Schematic representation of K+ binding in the conductive selectivity filter at high (top, two bound K+ ions) and low concentrations (bottom, one bound K+ ion). K+ and Na+ ions are represented by solid and open spheres, respectively.

References

    1. Hille B. Ion Channels of Excitable Membranes. 3rd. Sinauer Associates, Inc.; Sunderland, MA: 2001.
    1. Heginbotham L, Abramson T, MacKinnon R. A functional connection between the pores of distantly related ion channels as revealed by mutant K+ channels. Science. 1992;258:1152–1155. - PubMed
    1. Heginbotham L, Lu Z, Abramson T, MacKinnon R. Mutations in the K+ channel signature sequence. Biophys J. 1994;66:1061–1067. - PMC - PubMed
    1. Doyle DA, et al. The structure of the potassium channel: molecular basis of K+ conduction and selectivity. Science. 1998;280:69–77. - PubMed
    1. Zhou Y, Morais-Cabral JH, Kaufman A, MacKinnon R. Chemistry of ion coordination and hydration revealed by a K+ channel-Fab complex at 2.0 A resolution. Nature. 2001;414:43–48. - PubMed

Publication types