

doi: 10.1038/nmeth.1487.
Epub 2010 Aug 1.
Mechanical regulation of cell function with geometrically modulated elastomeric substrates
Affiliations
- PMID: 20676108
- PMCID: PMC3069358
- DOI: 10.1038/nmeth.1487
Item in Clipboard
Mechanical regulation of cell function with geometrically modulated elastomeric substrates
Nat Methods.
2010 Sep.
Erratum in
- Nat Methods. 2011 Feb;8(2):184
Abstract
We report the establishment of a library of micromolded elastomeric micropost arrays to modulate substrate rigidity independently of effects on adhesive and other material surface properties. We demonstrated that micropost rigidity impacts cell morphology, focal adhesions, cytoskeletal contractility and stem cell differentiation. Furthermore, early changes in cytoskeletal contractility predicted later stem cell fate decisions in single cells.
Conflict of interest statement
The authors declared no competing interests.
Figures
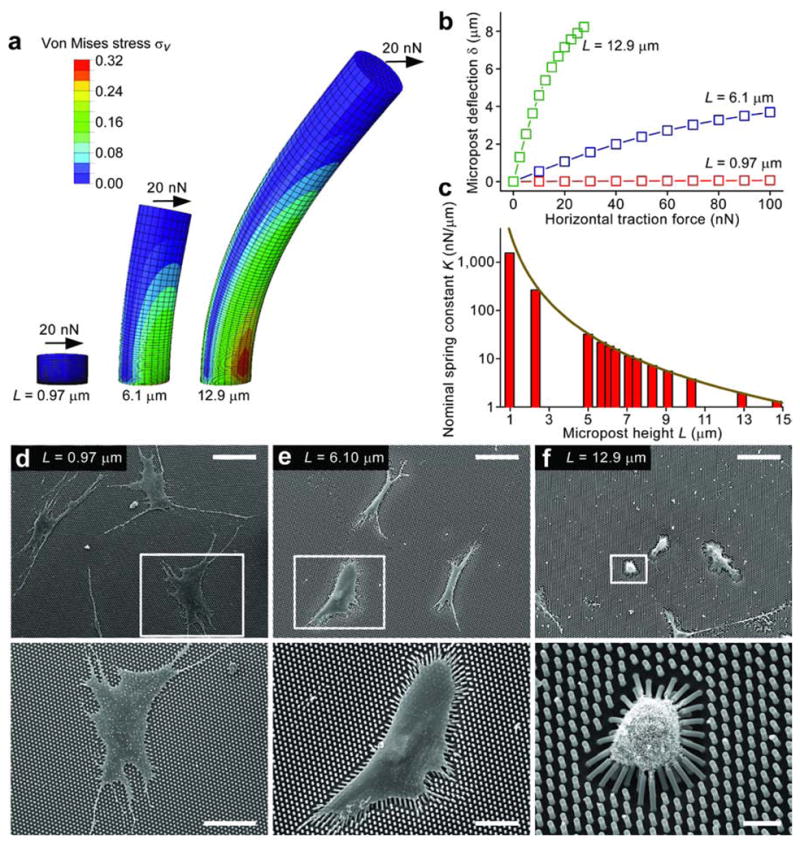
Micromolded elastomeric micropost arrays to engineer substrate rigidity. (a) Graphical depiction of finite-element method (FEM) analysis of microposts of different heights L each bending in response to applied horizontal traction force (F) of 20 nN (see Online Methods). (b) Micropost deflection δ is plotted as a function of F for microposts of heights used in (a), as calculated by FEM analysis. (c) Nominal spring constant K as a function of L, as computed from FEM (bars), and from the Euler-Bernoulli beam theory (dark yellow curve). K measures micropost rigidity. (d–f) Scanning electron micrographs of hMSCs plated on PDMS micropost arrays of the indicated heights. White rectangles show where the bottom images were taken. Scale bars: 100 μm (top), 50 μm (bottom left), 30 μm (bottom middle), and 10 μm (bottom right).
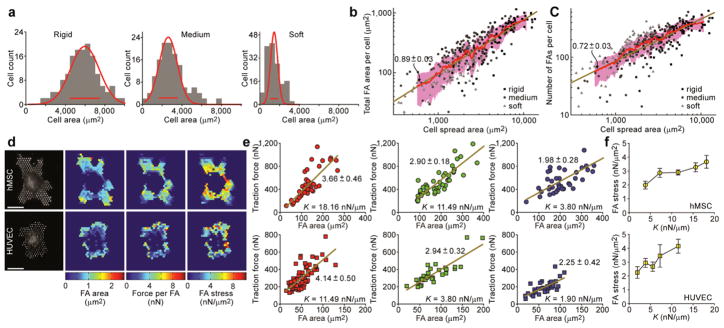
Quantitative analysis of cell morphology, FA, and traction force during rigidity-sensing. (a) Distributions of cell area for hMSCs plated on micropost arrays of different rigidities (rigid: L = 0.97 μm, k = 1,556 nN/μm; medium: L = 6.1 μm, k = 18.16 nN/μm; soft: L = 12.9 μm, k = 1.90 nN/μm). Gaussian functions (red curves) were used for fitting, and red bars centered on the mean and indicated peak widths. (b–c) Total FA area (b) and total number of FA sites (c) per single hMSCs plotted against hMSC area, for three different micropost arrays as indicated. Each data point represents an individual cell (n =322 cells). Data trends are plotted as Gaussian-weighted moving averages (red curves) ± one s.d. (pink regions), and are compared with the linear least square fitting (dark yellow lines, slope values are indicated). (d) Quantification of FA area and traction force for hMSCs (top) and HUVECs (bottom) plated on the micropost arrays. Scale bars, 30 μm. (e) Traction force per single cell is plotted as a function of FA area per single cell, for both hMSCs (top) and HUVECs (bottom) plated on micropost arrays of different rigidities. Each data point represents an individual cell. Linear least square fits are plotted as dark yellow lines with slope values indicated. (f) FA stress as determined by slope values of the linear least square fits in (e) plotted against micropost rigidity K, for both hMSCs (top) and HUVECs (bottom). Error bars indicate s.e.m.
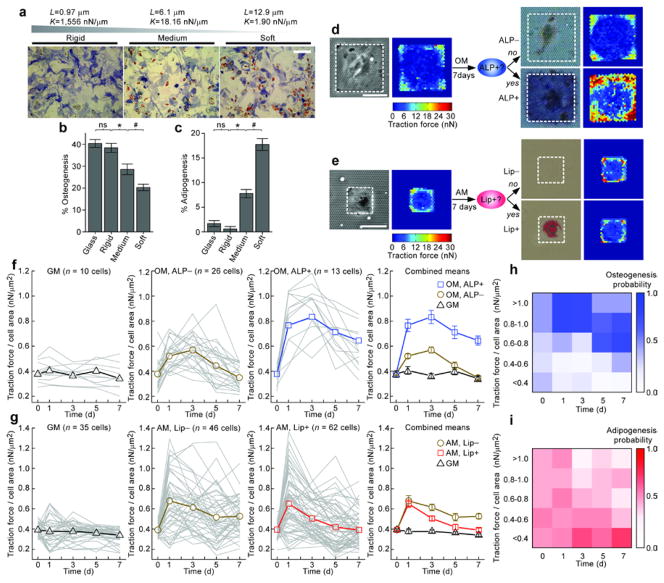
Micropost arrays regulated and predicted hMSC differentiation. (a) Brightfield micrographs of hMSCs stained for ALP and Lip after 14 days of culture in MM on micropost arrays of different rigidities. Scale bar, 300 μm. (b–c) Mean percentages of hMSC osteogenesis (b) and adipogenesis (c) as a function of micropost rigidity. Glass served as a control. Error bars, ±s.e.m. (n ≥ 3). b–c: ns (P > 0.05), *, # (P < 0.05); Student’s t-test. (d–e) Brightfield micrographs and corresponding traction force maps of micropatterned single hMSCs exposed to OM (d) or AM (e) for 7 days, and then stained for ALP (d) or Lip (e). White rectangles in micrographs highlight cell boundaries. Scale bars, 50 μm. (f–g) Evolution of traction forces (normalized to cell area) for individual micropatterned hMSCs (thin gray lines) and population means (bold lines with marker symbols) under different culture conditions as indicated. Staining is either for ALP (f) or Lip (g). Cells were grouped by medium treatment (GM, OM, or AM) and histological staining outcome (ALP+, ALP−, Lip+, or Lip−). Error bars, ±s.e.m. (h–i) Probability of differentiation of single hMSCs towards either osteogenesis (h) or adipogenesis (i) as a function of traction force (normalized to cell area) at different times.
Comment in
-
Stem cells feel the difference.Nat Methods. 2010 Sep;7(9):695-7. doi: 10.1038/nmeth0910-695. Nat Methods. 2010. PMID: 20805798 Free PMC article.
References
Publication types
MeSH terms
Substances
Grants and funding
LinkOut - more resources
Full Text Sources
Other Literature Sources
