Metabonomic fingerprints of fasting plasma and spot urine reveal human pre-diabetic metabolic traits
- PMID: 20676218
- PMCID: PMC2899018
- DOI: 10.1007/s11306-010-0203-1
Metabonomic fingerprints of fasting plasma and spot urine reveal human pre-diabetic metabolic traits
Abstract
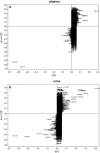
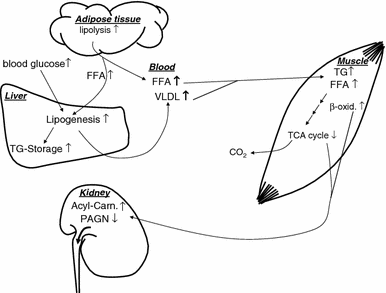
Impaired glucose tolerance (IGT) which precedes overt type 2 diabetes (T2DM) for decades is associated with multiple metabolic alterations in insulin sensitive tissues. In an UPLC-qTOF-mass spectrometry-driven non-targeted metabonomics approach we investigated plasma as well as spot urine of 51 non-diabetic, overnight fasted individuals aiming to separate subjects with IGT from controls thereby identify pathways affected by the pre-diabetic metabolic state. We could clearly demonstrate that normal glucose tolerant (NGT) and IGT subjects clustered in two distinct groups independent of the investigated metabonome. These findings reflect considerable differences in individual metabolite fingerprints, both in plasma and urine. Pre-diabetes associated alterations in fatty acid-, tryptophan-, uric acid-, bile acid-, and lysophosphatidylcholine-metabolism, as well as the TCA cycle were identified. Of note, individuals with IGT also showed decreased levels of gut flora-associated metabolites namely hippuric acid, methylxanthine, methyluric acid, and 3-hydroxyhippuric acid. The findings of our non-targeted UPLC-qTOF-MS metabonomics analysis in plasma and spot urine of individuals with IGT vs NGT offers novel insights into the metabolic alterations occurring in the long, asymptomatic period preceding the manifestation of T2DM thereby giving prospects for new intervention targets. ELECTRONIC SUPPLEMENTARY MATERIAL: The online version of this article (doi:10.1007/s11306-010-0203-1) contains supplementary material, which is available to authorized users.
Figures


Similar articles
-
Elevated 1-h post-load plasma glucose levels in subjects with normal glucose tolerance are associated with a pro-atherogenic lipid profile.Atherosclerosis. 2017 Jan;256:15-20. doi: 10.1016/j.atherosclerosis.2016.11.020. Epub 2016 Nov 17. Atherosclerosis. 2017. PMID: 27940375
-
Tumor necrosis factor alpha and insulin resistance in obese type 2 diabetic patients.Int J Obes Relat Metab Disord. 2003 Jan;27(1):88-94. doi: 10.1038/sj.ijo.0802187. Int J Obes Relat Metab Disord. 2003. PMID: 12532159
-
Impact of glucagon response on postprandial hyperglycemia in men with impaired glucose tolerance and type 2 diabetes mellitus.Metabolism. 2005 Sep;54(9):1168-73. doi: 10.1016/j.metabol.2005.03.024. Metabolism. 2005. PMID: 16125528
-
[Characteristics of glycemic excursion in different subtypes of impaired glucose intolerance].Zhonghua Yi Xue Za Zhi. 2009 Mar 17;89(10):669-72. Zhonghua Yi Xue Za Zhi. 2009. PMID: 19595059 Chinese.
-
Impaired glucose tolerance and impaired fasting glycaemia: the current status on definition and intervention.Diabet Med. 2002 Sep;19(9):708-23. doi: 10.1046/j.1464-5491.2002.00835.x. Diabet Med. 2002. PMID: 12207806 Review.
Cited by
-
[Metabonomics studies of urine from APP/PS1 mice with early-stage Alzheimer's disease].Zhejiang Da Xue Xue Bao Yi Xue Ban. 2018 Dec 25;47(6):636-642. doi: 10.3785/j.issn.1008-9292.2018.12.12. Zhejiang Da Xue Xue Bao Yi Xue Ban. 2018. PMID: 30900843 Free PMC article. Chinese.
-
Gut microbiota and the pathogenesis of insulin resistance.Curr Diab Rep. 2011 Jun;11(3):154-9. doi: 10.1007/s11892-011-0191-1. Curr Diab Rep. 2011. PMID: 21431853 Review.
-
Gut microbiome links obesity to type 2 diabetes: insights from Mendelian randomization.BMC Microbiol. 2025 Apr 27;25(1):253. doi: 10.1186/s12866-025-03968-8. BMC Microbiol. 2025. PMID: 40289103 Free PMC article.
-
Mass Spectrometry-based Metabolomics in Translational Research.Adv Exp Med Biol. 2021;1310:509-531. doi: 10.1007/978-981-33-6064-8_19. Adv Exp Med Biol. 2021. PMID: 33834448 Review.
-
Roles of Gut Microbial Metabolites in Diabetic Kidney Disease.Front Endocrinol (Lausanne). 2021 May 20;12:636175. doi: 10.3389/fendo.2021.636175. eCollection 2021. Front Endocrinol (Lausanne). 2021. PMID: 34093430 Free PMC article. Review.
References
-
- Abdul-Ghani MA, Jenkinson CP, Richardson DK, Tripathy D, DeFronzo RA. Insulin secretion and action in subjects with impaired fasting glucose and impaired glucose tolerance: Results from the Veterans Administration Genetic Epidemiology Study. Diabetes. 2006;55:1430–1435. doi: 10.2337/db05-1200. - DOI - PubMed
LinkOut - more resources
Full Text Sources
Other Literature Sources
