

Hierarchical Spatial Process Models for Multiple Traits in Large Genetic Trials
- PMID: 20676229
- PMCID: PMC2911798
- DOI: 10.1198/jasa.2009.ap09068
Hierarchical Spatial Process Models for Multiple Traits in Large Genetic Trials
Abstract
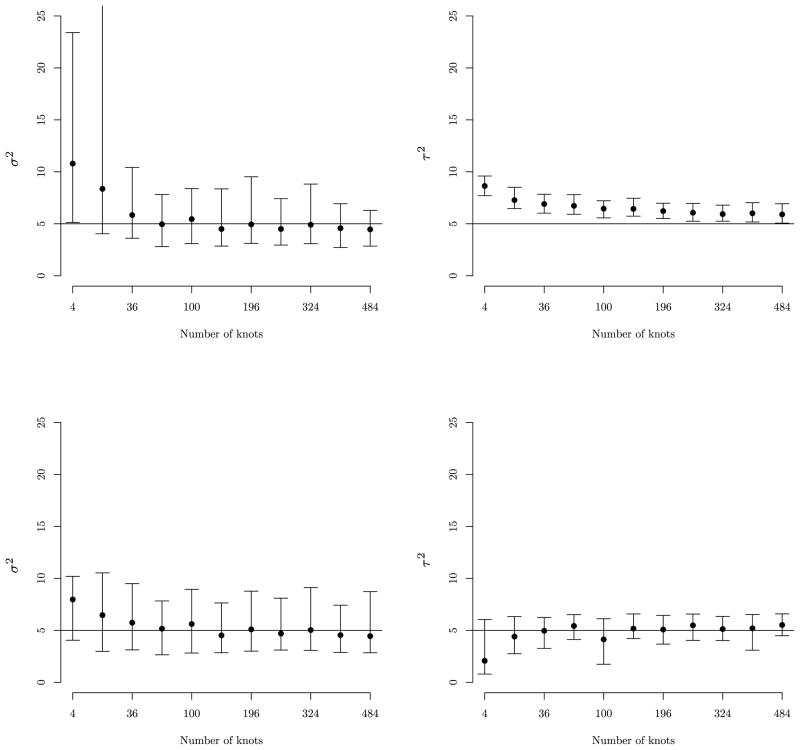
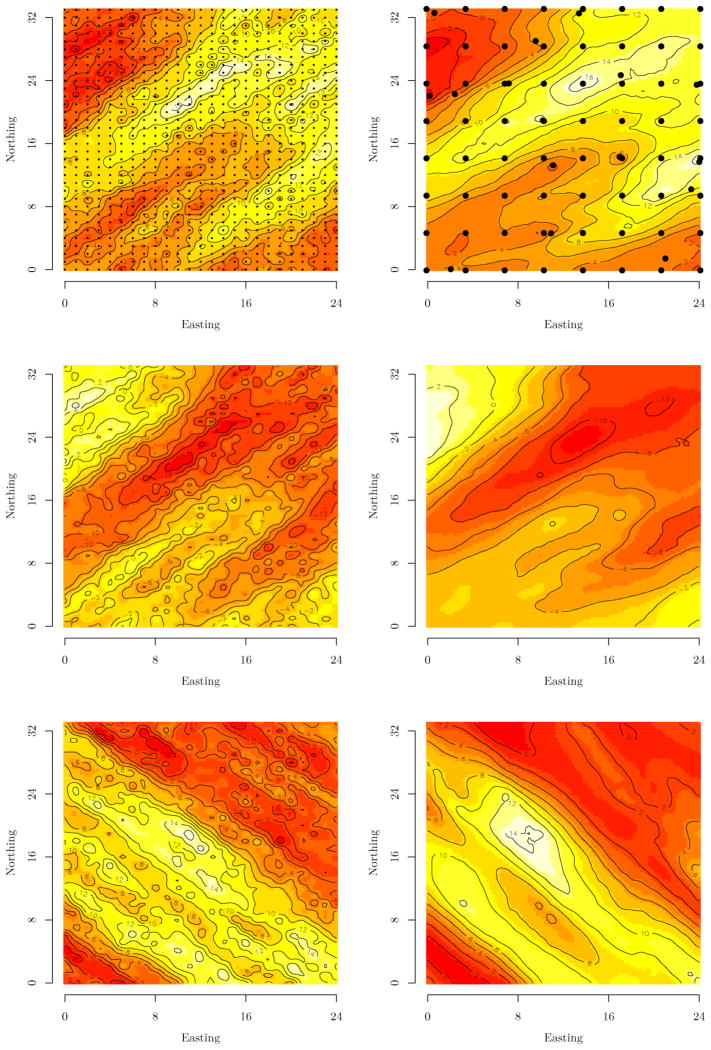
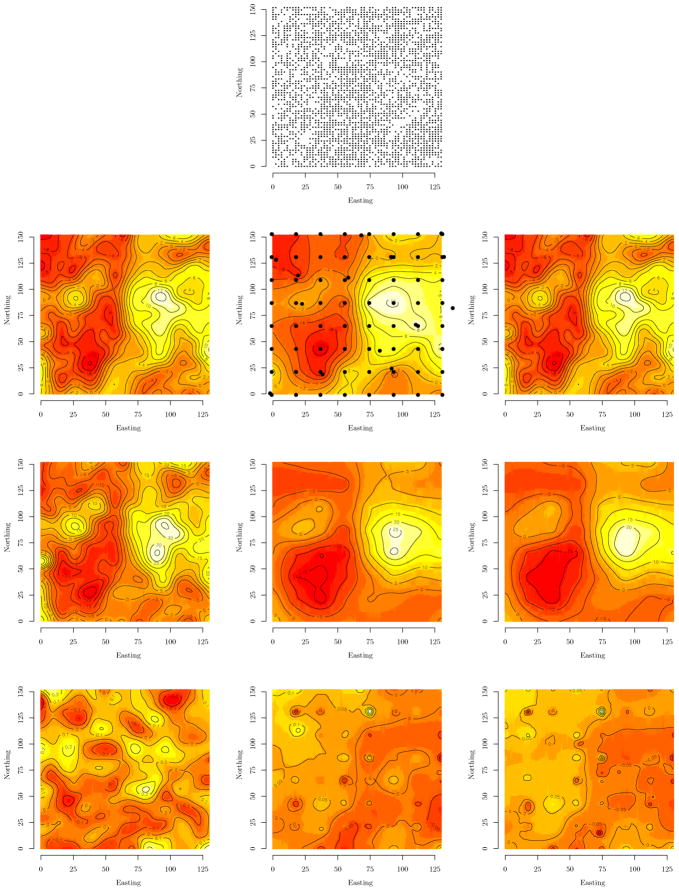
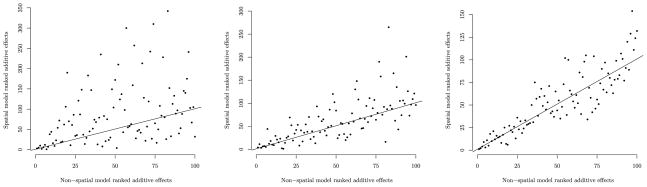
This article expands upon recent interest in Bayesian hierarchical models in quantitative genetics by developing spatial process models for inference on additive and dominance genetic variance within the context of large spatially referenced trial datasets of multiple traits of interest. Direct application of such multivariate models to large spatial datasets is often computationally infeasible because of cubic order matrix algorithms involved in estimation. The situation is even worse in Markov chain Monte Carlo (MCMC) contexts where such computations are performed for several thousand iterations. Here, we discuss approaches that help obviate these hurdles without sacrificing the richness in modeling. For genetic effects, we demonstrate how an initial spectral decomposition of the relationship matrices negates the expensive matrix inversions required in previously proposed MCMC methods. For spatial effects we discuss a multivariate predictive process that reduces the computational burden by projecting the original process onto a subspace generated by realizations of the original process at a specified set of locations (or knots). We illustrate the proposed methods using a synthetic dataset with multivariate additive and dominant genetic effects and anisotropic spatial residuals, and a large dataset from a scots pine (Pinus sylvestris L.) progeny study conducted in northern Sweden. Our approaches enable us to provide a comprehensive analysis of this large trial which amply demonstrates that, in addition to violating basic assumptions of the linear model, ignoring spatial effects can result in downwardly biased measures of heritability.
Figures
References
-
- Banerjee S, Carlin BP, Gelfand AE. Hierarchical Modeling and Analysis for Spatial Data. Boca Raton, FL: Chapman & Hall/CRC Press; 2004.
-
- Cappa EP, Cantet RJC. Bayesian Estimation of a Surface to Account for a Spatial Trend Using Penalized Splines in an Individual-Tree Mixed Model. Canadian Journal of Forest Research. 2007;37:2677–2688.
-
- Crainiceanu CM, Diggle PJ, Rowlingson B. Bivariate Binomial Spatial Modeling of Loa Loa Prevalence in Tropical Africa” (with discussion) Journal of the American Statistical Association. 2008;103:21–37.
-
- Cressie N. Statistics for Spatial Data. 2. New York: Wiley; 1993.
Grants and funding
LinkOut - more resources
Full Text Sources