

A runs-test algorithm: contingent reinforcement and response run structures
- PMID: 20676268
- PMCID: PMC2801541
- DOI: 10.1901/jeab.2010.93-61
A runs-test algorithm: contingent reinforcement and response run structures
Abstract
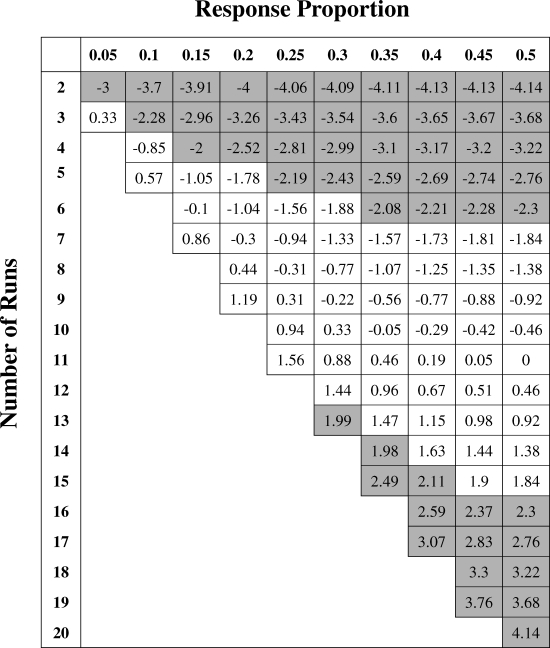
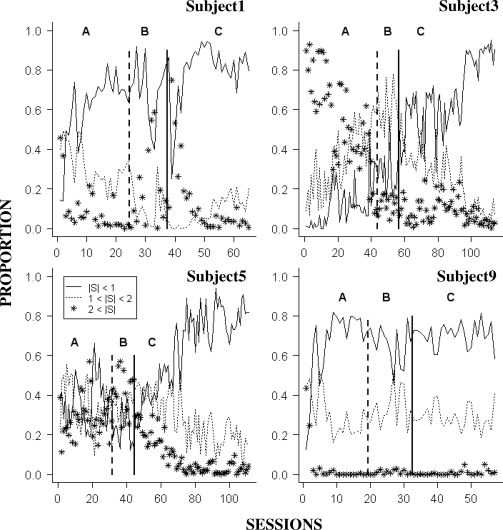
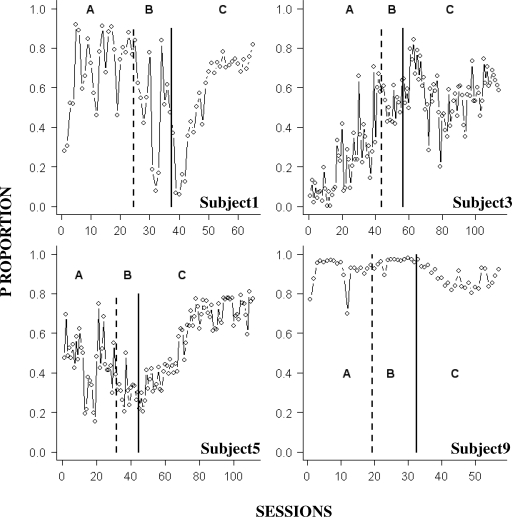
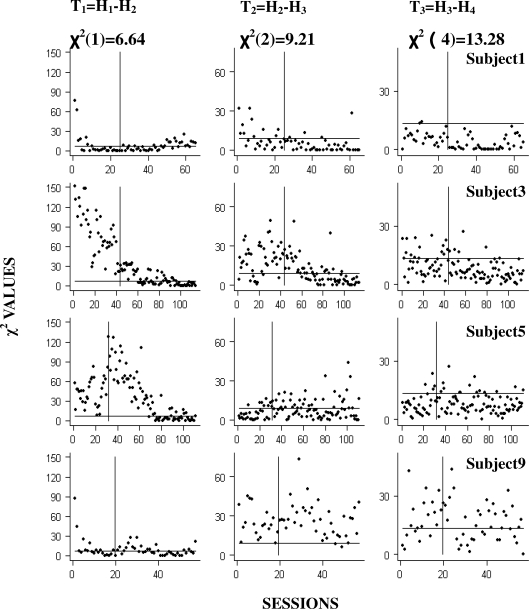
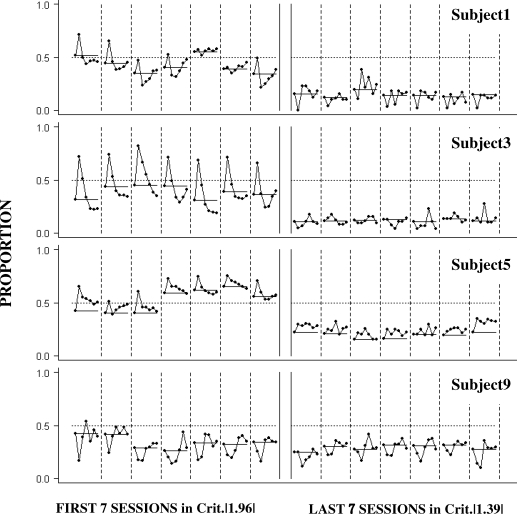
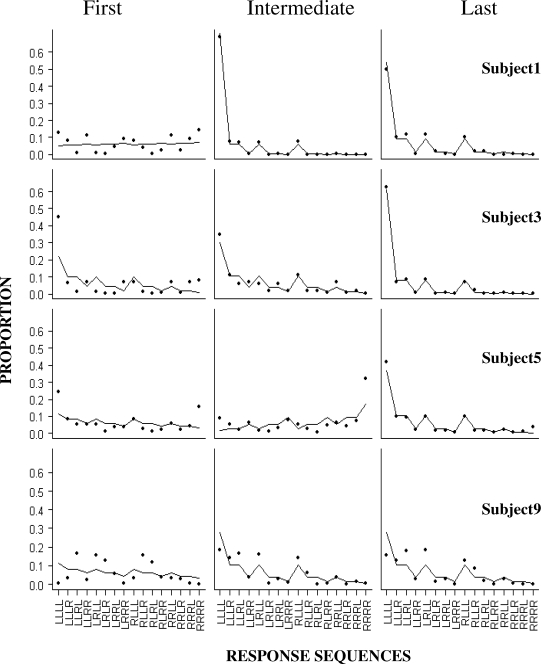
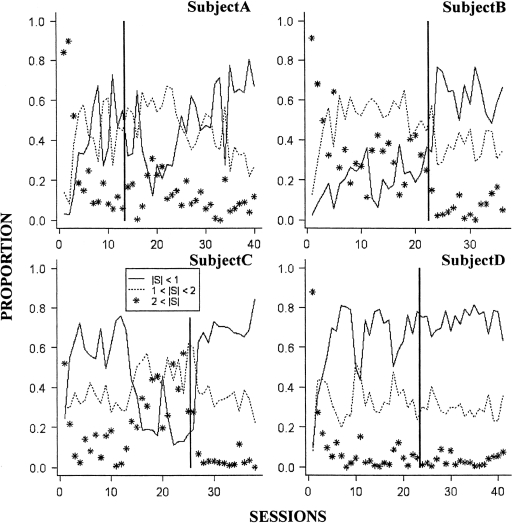
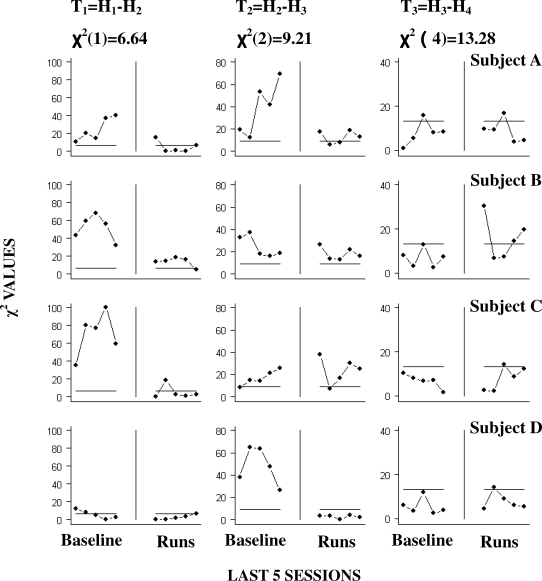
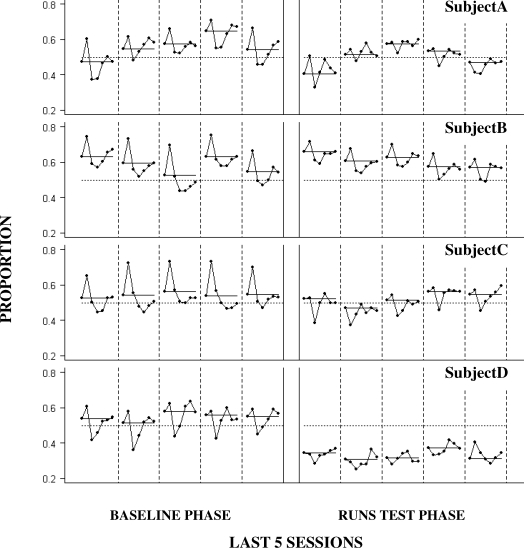
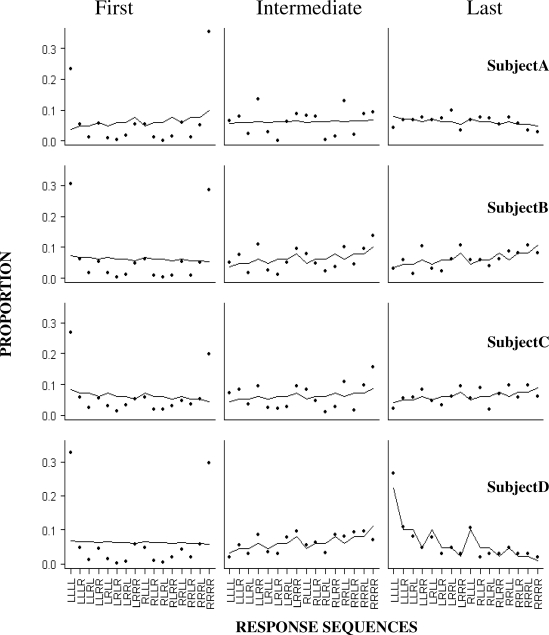
Four rats' choices between two levers were differentially reinforced using a runs-test algorithm. On each trial, a runs-test score was calculated based on the last 20 choices. In Experiment 1, the onset of stimulus lights cued when the runs score was smaller than criterion. Following cuing, the correct choice was occasionally reinforced with food, and the incorrect choice resulted in a blackout. Results indicated that this contingency reduced sequential dependencies among successive choice responses. With one exception, subjects' choice rule was well described as biased coin flipping. In Experiment 2, cuing was removed and the reinforcement criterion was changed to a percentile score based on the last 20 reinforced responses. The results replicated those of Experiment 1 in successfully eliminating first-order dependencies in all subjects. For 2 subjects, choice allocation was approximately consistent with nonbiased coin flipping. These results suggest that sequential dependencies may be a function of reinforcement contingency.
Keywords: behavioral variability; lever press; mutual uncertainty; rat; sequential dependency; the runs test.
Figures
Similar articles
-
Preference pulses and the win-stay, fix-and-sample model of choice.J Exp Anal Behav. 2015 Nov;104(3):274-95. doi: 10.1002/jeab.170. Epub 2015 Sep 29. J Exp Anal Behav. 2015. PMID: 26420769
-
Observing responses and serial stimuli: searching for the reinforcing properties of the S-.J Exp Anal Behav. 2009 Sep;92(2):215-31. doi: 10.1901/jeab.2009.92-215. J Exp Anal Behav. 2009. PMID: 20354600 Free PMC article.
-
Preference pulses induced by reinforcement.J Exp Anal Behav. 2014 Nov;102(3):335-45. doi: 10.1002/jeab.108. Epub 2014 Sep 30. J Exp Anal Behav. 2014. PMID: 25270509
-
Resurgence as Choice.Behav Processes. 2017 Aug;141(Pt 1):100-127. doi: 10.1016/j.beproc.2016.10.006. Epub 2016 Oct 26. Behav Processes. 2017. PMID: 27794452 Free PMC article. Review.
-
Preventing relapse after incentivized choice treatment: A laboratory model.Behav Processes. 2017 Aug;141(Pt 1):11-18. doi: 10.1016/j.beproc.2017.02.005. Epub 2017 Feb 7. Behav Processes. 2017. PMID: 28188809 Free PMC article. Review.
Cited by
-
Like chimpanzees (Pan troglodytes), pigeons (Columba livia domestica) match and Nash equilibrate where humans (Homo sapiens) do not.J Comp Psychol. 2019 May;133(2):197-206. doi: 10.1037/com0000144. Epub 2018 Oct 29. J Comp Psychol. 2019. PMID: 30372107 Free PMC article.
References
-
- Alleman H.D, Platt J.R. Differential reinforcement of interresponse times with controlled probability of reinforcement per response. Learning and Motivation. 1973;4:40–73.
-
- Attneave F. New York: Holt, Rinehart & Winston; 1959. Applications of information theory to psychology.
Publication types
MeSH terms
LinkOut - more resources
Full Text Sources
