. 2010 Jul 28;5(7):e11592.
doi: 10.1371/journal.pone.0011592.

Cocaine is low on the value ladder of rats: possible evidence for resilience to addiction

Affiliations

Cocaine is low on the value ladder of rats: possible evidence for resilience to addiction

Lauriane Cantin et al. PLoS One. .

Abstract

Background: Assessing the relative value of cocaine and how it changes with chronic drug use represents a long-standing goal in addiction research. Surprisingly, recent experiments in rats--by far the most frequently used animal model in this field--suggest that the value of cocaine is lower than previously thought.

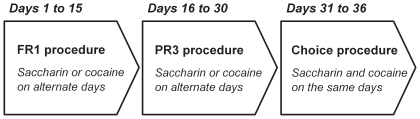
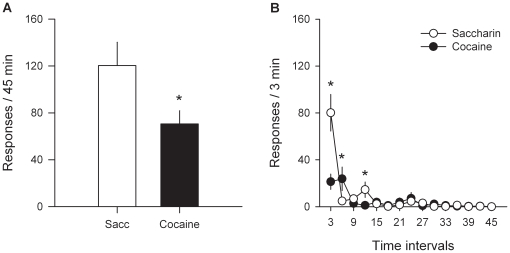
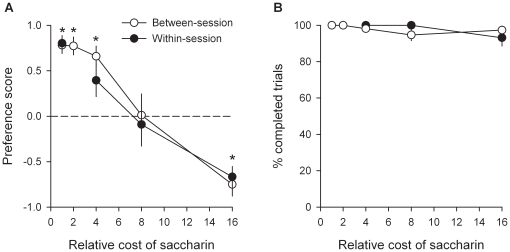
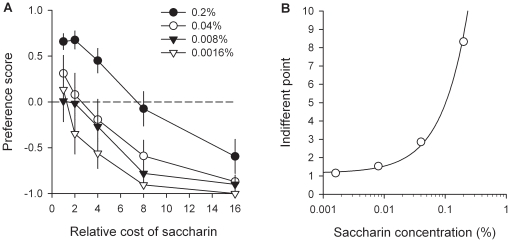
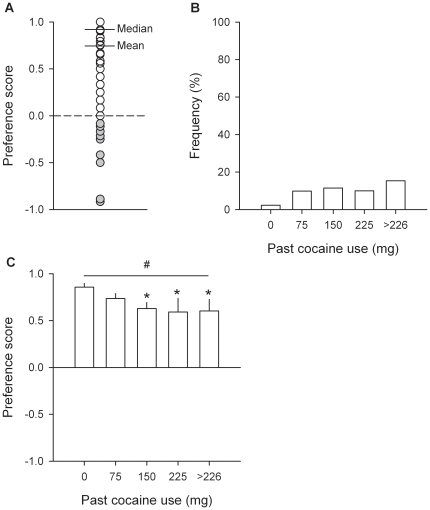
Methodology/principal findings: Here we report a series of choice experiments that better define the relative position of cocaine on the value ladder of rats (i.e., preference rank-ordering of different rewards). Rats were allowed to choose either taking cocaine or drinking water sweetened with saccharin--a nondrug alternative that is not biologically essential. By systematically varying the cost and concentration of sweet water, we found that cocaine is low on the value ladder of the large majority of rats, near the lowest concentrations of sweet water. In addition, a retrospective analysis of all experiments over the past 5 years revealed that no matter how heavy was past cocaine use most rats readily give up cocaine use in favor of the nondrug alternative. Only a minority, fewer than 15% at the heaviest level of past cocaine use, continued to take cocaine, even when hungry and offered a natural sugar that could relieve their need of calories.

Conclusions/significance: This pattern of results (cocaine abstinence in most rats; cocaine preference in few rats) maps well onto the epidemiology of human cocaine addiction and suggests that only a minority of rats would be vulnerable to cocaine addiction while the large majority would be resilient despite extensive drug use. Resilience to drug addiction has long been suspected in humans but could not be firmly established, mostly because it is difficult to control retrospectively for differences in drug self-exposure and/or availability in human drug users. This conclusion has important implications for preclinical research on the neurobiology of cocaine addiction and for future medication development.


Conflict of interest statement

Competing Interests: The authors have declared that no competing interests exist.

Figures

Figure 1
Figure 1. Diagram of the design of the first experiment.
For additional information, see the text.
Figure 2
Figure 2. Differential PR responding for cocaine and saccharin.
Bars represent the means (± s.e.m.) over the last 3 stable testing sessions of: (A) total responses, (B) rewards earned and (C) breakpoints as a function of reward type [cocaine versus saccharin (sacc)]. *, different from sweet water [P<0.01, one-way analysis of variance (ANOVA)].
Figure 3
Figure 3. Comparison between reward assessment procedures.
(A) Choice between water sweetened with saccharin and cocaine. The horizontal dashed line at 0 indicates the indifference level. Values above 0 indicate a preference for sweet water while values below 0 indicate a preference for intravenous cocaine. *, different from the first day (P<0.05, Fisher's LSD test following a one-way ANOVA); #, different from the indifference level (P<0.05, t-test). (B) Correlation between individual PR and preference scores. The x-axis corresponds to the PR score (difference in breakpoints between saccharin and cocaine; see Results) while the y-axis corresponds to the preference score as measured in the choice procedure (see Materials and Methods). The vertical dashed line at 0 indicates that the breakpoint of cocaine was equal to that of sweet water. Values on the left or on the right of this vertical line indicate that the breakpoint of cocaine is higher or lower than the breakpoint of sweet water, respectively. Open circles represent individuals whose PR and preference scores are incongruent; closed circles represent individuals whose PR and preference scores are congruent. Note that rats with a PR score ≥-3 or ≤3 (i.e., only one step size in the PR3 schedule) were considered to work equally for both types of reward.
Figure 4
Figure 4. Effects of post-reward delay on PR responding for cocaine.
Bars represent the means (± s.e.m.) over the last 3 stable testing sessions of: (A) total responses and (B) breakpoints as a function of reward type (cocaine versus saccharin) and of post-reward delay (0 versus 10 min). *, different from saccharin (P<0.01, Fisher's LSD test following a two-way ANOVA); #, different from 0-min delay (P<0.01, Fisher's LSD test following a two-way ANOVA).
Figure 5
Figure 5. Concurrent extinction of responding for cocaine and saccharin.
During extinction testing, the lever previously associated with cocaine was presented concurrently with the lever previously associated with saccharin during 45 min. Pressing on either lever was recorded but had no programmed consequence (no response-contingent reward delivery or light cue presentation). (A) Bars represent the mean total number of responses (± s.e.m.) on the cocaine- and saccharin-associated levers over the 45-min extinction period. *, different from the other reward (P<0.05, one-way ANOVA); (B) Curves represent within-session time course of extinction responding on the two levers (means ± s.e.m.). *, different from the other reward (P<0.01, Fisher's LSD test following a two-way ANOVA).
Figure 6
Figure 6. Estimation of the relative value of cocaine.
Curves represent (A) choice between cocaine and water sweetened with saccharin and (B) percent of completed trials as a function of the relative cost of saccharin. The cost of saccharin was gradually increased either between sessions (open circles) or within sessions (closed circles). In the former case, each cost level was tested at least 5 times consecutively until stabilization of behavior. Data points represent the means (± s.e.m.) of the last 3 stable testing sessions. For other details, see Materials and Methods, and legend of Figure 3. *, different from the indifference level (P<0.05, t-test).
Figure 7
Figure 7. Estimation of the relative value of cocaine as a function of saccharin concentration.
Cost-effect curves for each saccharin concentration (A) were established in a within-session manner. Each concentration was tested at least 5 times consecutively until stabilization of behavior. Data curves represent the means (± s.e.m.) of the last 3 stable testing sessions. Indifferent points for each concentration of saccharin (B) were estimated by fitting the corresponding cost-effect curves using a normal sigmoid function. For other details, see Materials and Methods, and legend of Figure 6.
Figure 8
Figure 8. Effects of severity of past cocaine use on cocaine choice.
(A) Distribution of individual preferences regardless of past cocaine use. Only 16 individuals out of a total of 184 rats tested in the choice procedure preferred cocaine over water sweetened with saccharin (closed circles). (B) Histograms represent the frequency of cocaine-preferring individuals (i.e., cocaine choices >50% of completed trials over the last 3 stable testing sessions) as a function of past cocaine use (i.e., amount of self-administered cocaine prior to choice testing). (C) Bars represent mean (± s.e.m.) preference over the last 3 stable testing sessions as a function of past cocaine use. For other details, see Materials and Methods, and legend of Figure 3. #, different from the indifference level (P<0.05, t-test); *, different from the lowest level of severity (P<0.01, Fisher's LSD test following a one-way ANOVA).
Figure 9
Figure 9. Cocaine-induced locomotion as a function of individual preference.
Locomotion (i.e., mean number of cage crossings per min ± s.e.m.) was measured during 10 min after the first cocaine sampling (0.25 mg, i.v.) and was averaged across the last 3 stable choice sessions for each individual. The arrow indicates the intravenous injection of cocaine. The shaded area indicates the mean pre-injection level of locomotion (± s.e.m.). Note that the first cocaine sampling was followed 10 min later by the first saccharin sampling.
Figure 10
Figure 10. Effects of food restriction on cocaine preference.
Cost-effect curves for saccharin (0.2%) or sucrose (10%) were established in a within-session manner in both (A) hungry non drug-preferring (n = 8) and (B) hungry cocaine-preferring rats (n = 3). Each sweetener was tested at least 5 times consecutively until stabilization of behavior. Data curves represent the means (± s.e.m.) of the last 3 stable testing sessions. For other details, see Materials and Methods, and legend of Figure 6.
Figure 11
Figure 11. Position of cocaine on the value ladder of rats.
Indifference points between cocaine and other types of reward (i.e., different concentrations of saccharin; sucrose) are measured in the same units (i.e., X times the cost of cocaine) and can thus be reported on the same scale. It is reasonably assumed that the indifference point between cocaine and cocaine is 1 (indicated in the graph by the closed circle at the bottom of the scale). Open and gray circles represent indifferent points measured in non-restricted and food-restricted rats, respectively. Note the reproducibility across different experiments (n = 3) of the measurements of the indifference point between cocaine and the highest concentration of saccharin (0.2%).

References

    1. Dackis CA, Gold MS. New concepts in cocaine addiction: the dopamine depletion hypothesis. Neurosci Biobehav Rev. 1985;9:469–477. - PubMed
    1. Gawin FH. Cocaine addiction: psychology and neurophysiology. Science. 1991;251:1580–1586. - PubMed
    1. Redish AD. Addiction as a computational process gone awry. Science. 2004;306:1944–1947. - PubMed
    1. Van Dyck C, Byck R. Cocaine. Scientific American. 1982;246:128–141. - PubMed
    1. Volkow ND, Wise RA. How can drug addiction help us understand obesity? Nat Neurosci. 2005;8:555–560. - PubMed

Publication types