

The impact of progress indicators on task completion
- PMID: 20676386
- PMCID: PMC2910434
- DOI: 10.1016/j.intcom.2010.03.001
The impact of progress indicators on task completion
Abstract
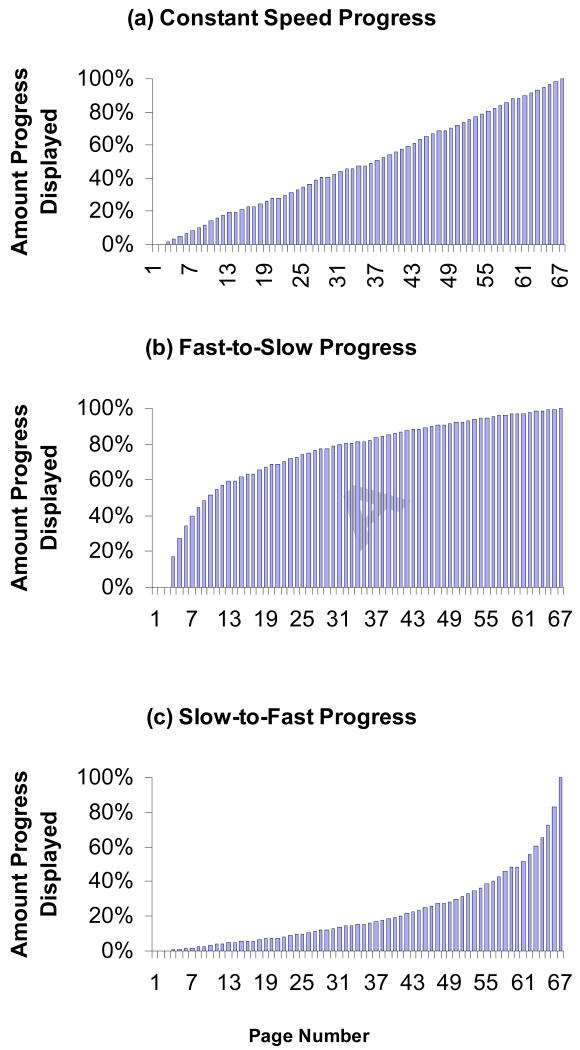
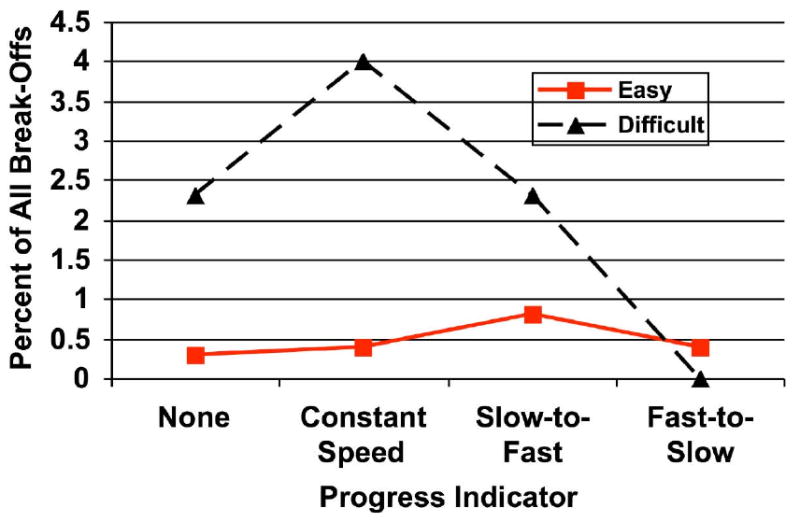
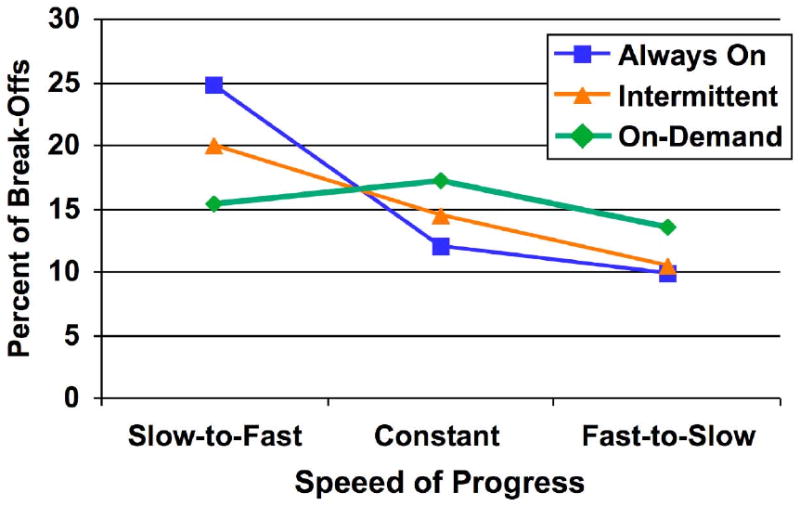
A near ubiquitous feature of user interfaces is feedback on task completion or progress indicators such as the graphical bar that grows as more of the task is completed. The presumed benefit is that users will be more likely to complete the task if they see they are making progress but it is also possible that feedback indicating slow progress may sometimes discourage users from completing the task. This paper describes two experiments that evaluate the impact of progress indicators on the completion of on-line questionnaires. In the first experiment, progress was displayed at different speeds throughout the questionnaire. If the early feedback indicated slow progress, abandonment rates were higher and users' subjective experience more negative than if the early feedback indicated faster progress. In the second experiment, intermittent feedback seemed to minimize the costs of discouraging feedback while preserving the benefits of encouraging feedback. Overall, the results suggest that when progress seems to outpace users' expectations, feedback can improve their experience though not necessarily their completion rates; when progress seems to lag behind what users expect, feedback degrades their experience and lowers completion rates.
Figures
References
-
- Boltz MG. Time estimation and expectancies. Memory and Cognition. 1993b;21:853–863. - PubMed
-
- Boltz MG. The processing of temporal and nontemporal information in the remembering of event durations and musical structure. Journal of Experimental Psychology: Human Perception & Performance. 1998;24:1087–1104. - PubMed
-
- Chang L, Krosnick J. National surveys via RDD telephone interviewing versus the Internet: Comparing sample representativeness and response quality. Public Opinion Quarterly. 2009;73:641–679.
-
- Conrad FG, Couper MP, Tourangeau R, Peytchev A. Use and non-use of clarification features in web surveys. Journal of Official Statistics. 2006;22:245–269.
-
- Couper M, Traugott M, Lamias M. Web survey design and administration. Public Opinion Quarterly. 2001;65:230–253. - PubMed
Grants and funding
LinkOut - more resources
Full Text Sources
Other Literature Sources
