. 2010 Nov;2(11-12):639-47.
doi: 10.1039/c0ib00011f. Epub 2010 Aug 2.

Directional decisions during neutrophil chemotaxis inside bifurcating channels

Affiliations

Directional decisions during neutrophil chemotaxis inside bifurcating channels

Vijayakrishnan Ambravaneswaran et al. Integr Biol (Camb). 2010 Nov.

Abstract

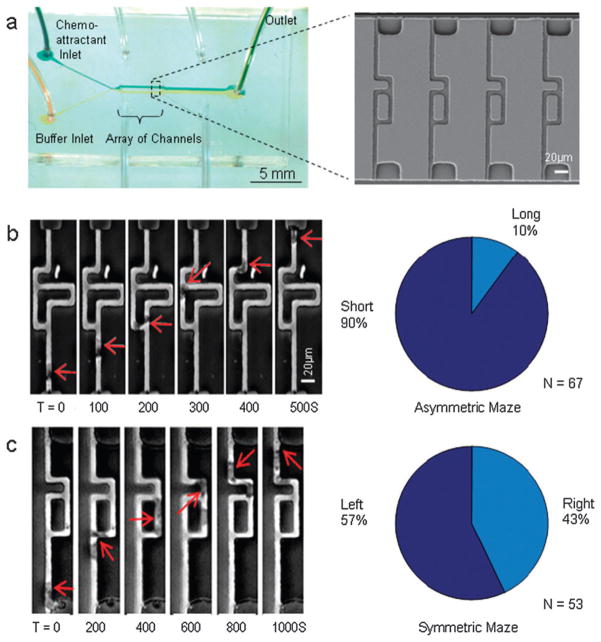
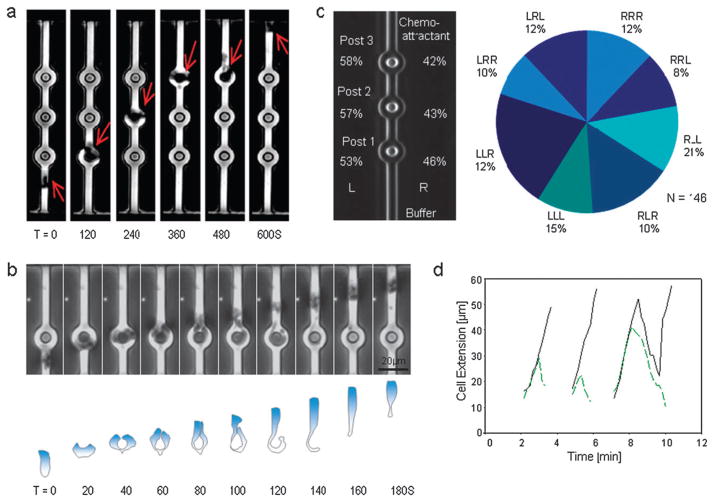
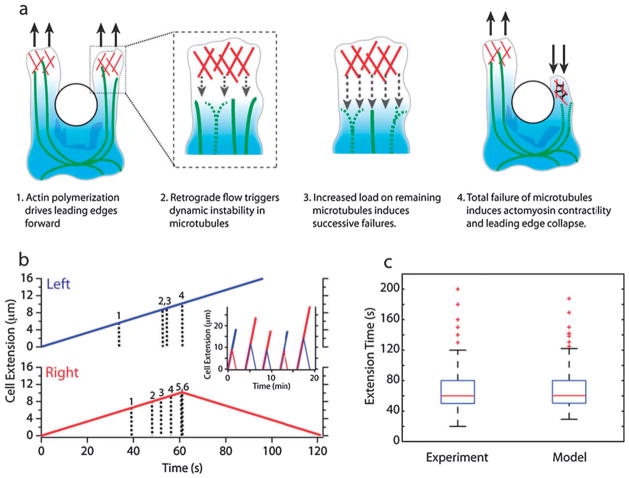
The directional migration of human neutrophils in classical chemotaxis assays is often described as a "biased random walk" implying significant randomness in speed and directionality. However, these experiments are inconsistent with in vivo observations, where neutrophils can navigate effectively through complex tissue microenvironments towards their targets. Here, we demonstrate a novel biomimetic assay for neutrophil chemotaxis using enclosed microfluidic channels. Remarkably, under these enclosed conditions, neutrophils recapitulate the highly robust and efficient navigation observed in vivo. In straight channels, neutrophils undergo sustained, unidirectional motion towards a chemoattractant source. In more complex maze-like geometries, neutrophils are able to select the most direct route over 90% of the time. Finally, at symmetric bifurcations, neutrophils split their leading edge into two sections and a "tug of war" ensues. The competition between the two new leading edges is ultimately resolved by stochastic, symmetry-breaking behavior. This behavior is suggestive of directional decision-making localized at the leading edge and a signaling role played by the cellular cytoskeleton.


Figures

Fig. 1
Fig. 1. Chemotaxis assay for neutrophil migration and directional decision making in bifurcating channels
(a) Overall image of the microfluidic device. Buffer and chemokine were introduced from the left and split symmetrically on the two sides of the array. This created the conditions for an exclusively diffusion-driven gradient along the channels in array. A detail of the channel array, imaged using scanning electron microscope is presented. (b) Inside asymmetric mazes, human neutrophils chose the shorter path towards the source of fMLP 100 nM in the top channel in 90% of the observations (red outline). (c) In control experiments, human neutrophils showed no significant preference for path in symmetric mazes. The position of the neutrophils in the images is indicated by the red arrow, and displayed at 100 or 200 s intervals.
Fig. 2
Fig. 2. Human neutrophil chemotaxis through channels with posts
(a) Time sequence of images showing one human neutrophil migrating through a channel with 6 μm posts placed symmetrically inside the channel at 30 μm separation, toward a source of fMLP 100 nM. Individual frames at 120 s intervals are grouped in a montage. (b) Time sequence montage showing successive images of one neutrophil migrating through a channel with posts. After first touching the post, the leading edge of the neutrophil split into two leading edges that extended on either side of the posts. One of the protrusions rapidly retracted and the neutrophil passed the post on the other side. The contour of the neutrophil moving around the post is outlined in the lower panel. (c) Neutrophils passed each post to the left (L) or right (R) with statistically-equal frequencies. They also picked either one of the eight alternative paths around the three successive posts with equal chances. The pie-chart indicates the observed frequencies for each of the eight combinations of three consecutive left and right decisions, e.g. LRL = left at first post, right at second post, left at third post. (d) The length of the two extensions during the interaction between one neutrophil and three successive posts. The “winning” extensions (solid black line) had the same slope during the interaction with each post. The timing for the collapse of the “losing” leading edge (green dashed line) was different for each of the three posts. The “winning” and “losing” edges had similar extension dynamics before the collapse. In this particular example, during the interaction with the third post, the “winning” leading edge also collapsed for a brief time before switching again to extension behavior.
Fig. 3
Fig. 3. Quantitative analysis of neutrophil migration through bifurcating channels
(a) Average time for the extension (Ex) and collapse (Co) of the leading edges at bifurcations. During interactions with each of the three successive posts in a channel, the time for leading edge collapse was always shorter than the time for leading edge extension. When passing the asymmetric or symmetric bifurcations, however, the collapse of the extended leading edge was faster than after interaction with the posts (p < 0.05). The two sets of data for these conditions represent the splitting and merging of the channels, respectively. The horizontal lines indicate the median, 50% of the values are confined to the box, 90% of the values fall between the whiskers, and the outliers are indicated by dots. (b) For individual neutrophils, there is no correlation between the extension time for the leading edges during interaction with the first and third post. A straight line fit to the data shows the lack of correlation. Each dot represents one neutrophil. (c) We divided the length of the channel in five sections of approximately equal length (20 μm) that include sections with posts and straight sections, alternatively. The average time for passing through each of the five sections of equal length was similar regardless of the presence of post (86.5, 72.0, 96.3, 90.9, 86.0 s in sections from A to E, N=46). The box plot indicates the median, 50% of the values are confined to the box, 90% of the values fall between the whiskers, and the outliers are indicated by dots. (d) For most neutrophils, the velocity in the straight sections between posts was constant throughout the channel for individual neutrophils. In some of the observed neutrophils, the advance of the leading edge temporarily slowed down as the neutrophils passed by the posts, and the constant velocity was resumed in the straight sections of the channel. (e) Time sequence of images showing one human neutrophil migrating through a small channel 3 × 6 μm, toward a source of fMLP 100 nM. Individual frames at 50 s intervals are grouped in a montage. (f) Upon entering the straight channels, more than 90% of all cells observed (N= 70 human neutrophils, from 5 healthy donors) moved through persistently, without any pause. Median velocities ranged from 1 to 18 μm/min for all neutrophils, with 67% of cells having a median velocity from 3 to 10 μm/min. For every neutrophil, the velocity was relatively constant for the entire time inside the channels.
Fig. 4
Fig. 4. Proposed model for local directional decision making in human neutrophils interacting with posts
(a) Dynamics of the cytoskeleton during the interaction with the posts. (b) Simulated trajectory of successful (blue) and failing (red) leading edges containing six dynamic microtubules with a characteristic Poisson timescale of 40 s. During the time shown, the successful leading edge (blue) remains intact since it undergoes random microtubule collapses at well separated times of t = 33 s, 53 s and 61 s, respectively. In contrast, the failing leading edge (red) undergoes random microtubule collapses at closely spaced time intervals, starting at t = 39 s, with subsequent failures every 4 s or less. This causes sudden and large increases in load on the remaining microtubules that trigger their subsequent collapse. At t=61 s, the total catastrophic failure of all microtubules causes the leading edge to begin retracting. In the inset, five simulated trajectories are shown that were generated using these same parameters. (c) A comparison between simulated and observed extension time of the two leading edges, during the interaction between neutrophils and posts, shows good qualitative and quantitative agreement between the two. The stochastic behavior and the highly asymmetric distribution are relatively insensitive to the choice of parameters. Parameters were selected to match the experiments, particularly the median timescale of 60 s.

Similar articles

Cited by

References

    1. Bodey GP, Buckley M, Sathe YS, Freireich EJ. Ann Intern Med. 1966;64:328–340. - PubMed
    1. Nathan C, Srimal S, Farber C, Sanchez E, Kabbash L, Asch A, Gailit J, Wright SD. J Cell Biol. 1989;109:1341–1349. - PMC - PubMed
    1. Tharp WG, Yadav R, Irimia D, Upadhyaya A, Samadani A, Hurtado O, Liu SY, Munisamy S, Brainard DM, Mahon MJ, Nourshargh S, van Oudenaarden A, Toner MG, Poznansky MC. J Leukocyte Biol. 2006;79:539–554. - PubMed
    1. Mathias JR, Walters KB, Huttenlocher A. Methods Mol Biol. 2009;571:151–166. - PubMed
    1. Zigmond SH. J Cell Biol. 1977;75:606–616. - PMC - PubMed

Publication types