

The effect of format on parents' understanding of the risks and benefits of clinical research: a comparison between text, tables, and graphics
- PMID: 20677054
- PMCID: PMC2915576
- DOI: 10.1080/10810730.2010.492560
The effect of format on parents' understanding of the risks and benefits of clinical research: a comparison between text, tables, and graphics
Abstract
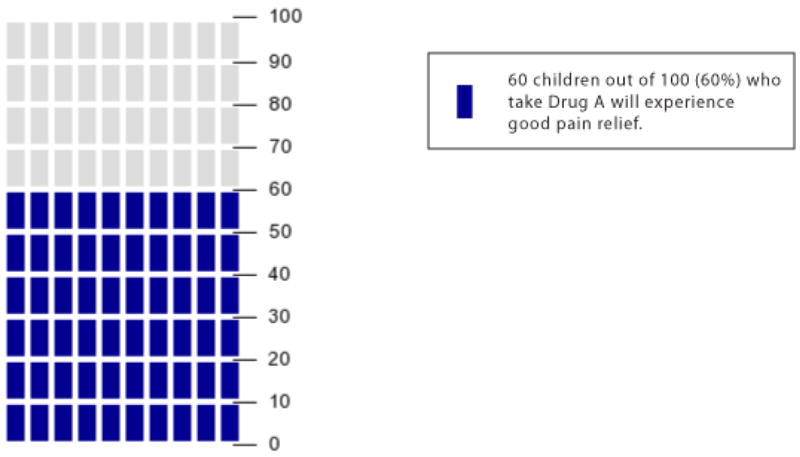
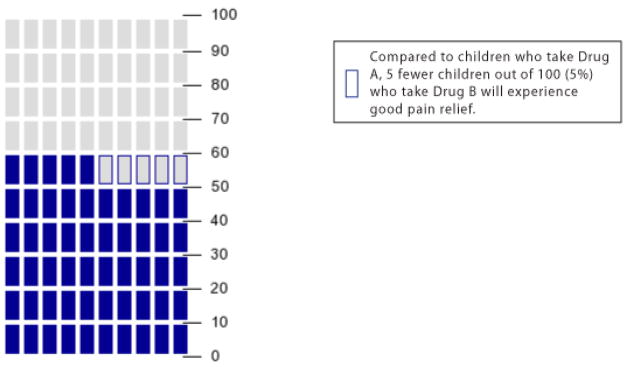
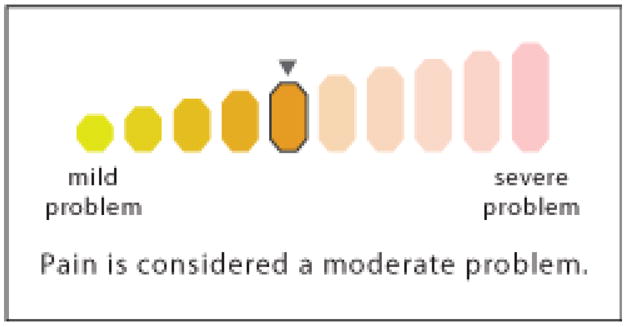
There is a paucity of information regarding the optimal method of presenting risk/benefit information to parents of pediatric research subjects. This study, therefore, was designed to examine the effect of different message formats on parents' understanding of research risks and benefits. An Internet-administered survey was completed by 4,685 parents who were randomized to receive risk/benefit information about a study of pediatric postoperative pain control presented in different message formats (text, tables, and pictographs). Survey questions assessed participants' gist and verbatim understanding of the information and their perceptions of the risks and benefits. Pictographs were associated with significantly (p < .05) greater likelihood of adequate gist and verbatim understanding compared with text and tables regardless of the participants' numeracy. Parents who received the information in pictograph format perceived the risks to be lower and the benefits to be higher compared with the other formats (p < .001). Furthermore, compared with text and tables, pictographs were perceived as more "effective," "helpful," and "trustworthy" in presenting risk/benefit information. These results underscore the difficulties associated with presenting risk/benefit information for clinical research but suggest a simple method for enhancing parents' informed understanding of the relevant statistics.
Figures
References
-
- Brundage M, Feldman-Stewart D, Leis A, Bezjak A, Degner L, Velji K, et al. Communicating quality of life information to cancer patients: A study of six presentation formats. J Clin Oncol. 2005;23:6949–6956. - PubMed
-
- Fagerlin A, Zikmund-Fisher B, Ubel P, Jankovic A, Derry H, Smith D. Measuring numeracy without a math test: Development of the subjective numeracy scale (SNS) Med Dec Making. 2007;27:672–680. - PubMed
-
- Feldman-Stewart D, Brundage M, Zotov V. Further insight into the perception of quantitative information: Judgments of gist in treatment decisions. Med Dec Making. 2007;27:34–43. - PubMed
Publication types
MeSH terms
Grants and funding
LinkOut - more resources
Full Text Sources
Medical