. 2010 Aug;32(2):267-75.
doi: 10.1002/jmri.22263.

Glioma morphology and tumor-induced vascular alterations revealed in seven rodent glioma models by in vivo magnetic resonance imaging and angiography

Affiliations

Glioma morphology and tumor-induced vascular alterations revealed in seven rodent glioma models by in vivo magnetic resonance imaging and angiography

Sabrina Doblas et al. J Magn Reson Imaging. 2010 Aug.

Abstract

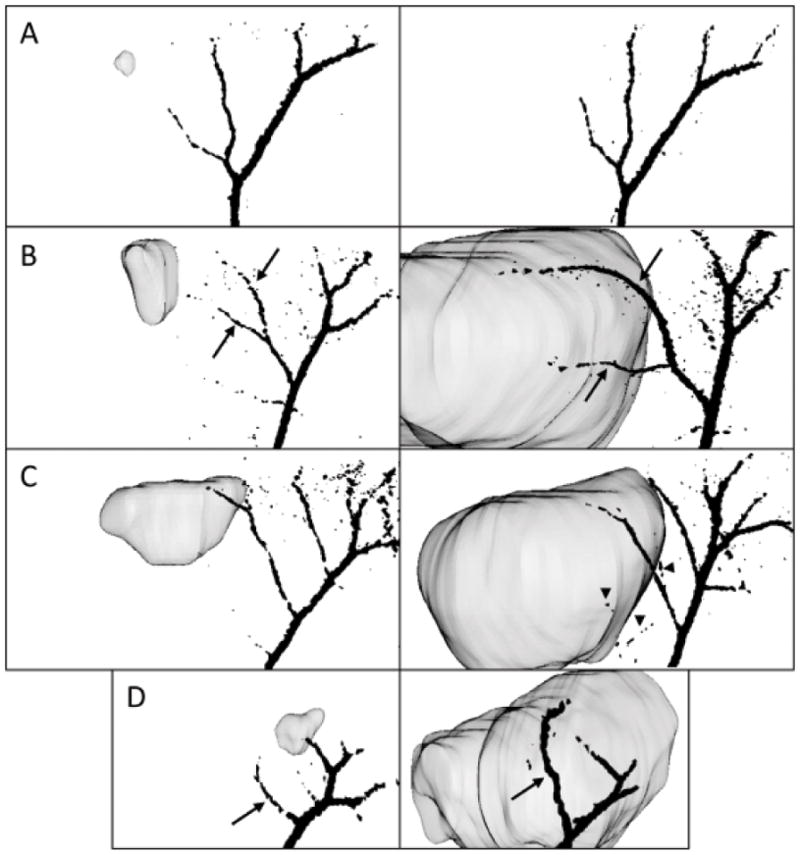
Purpose: To evaluate the added value of non-contrast-enhanced MR angiography (MRA) to conventional MR imaging for a detailed characterization of different rodent glioma models.

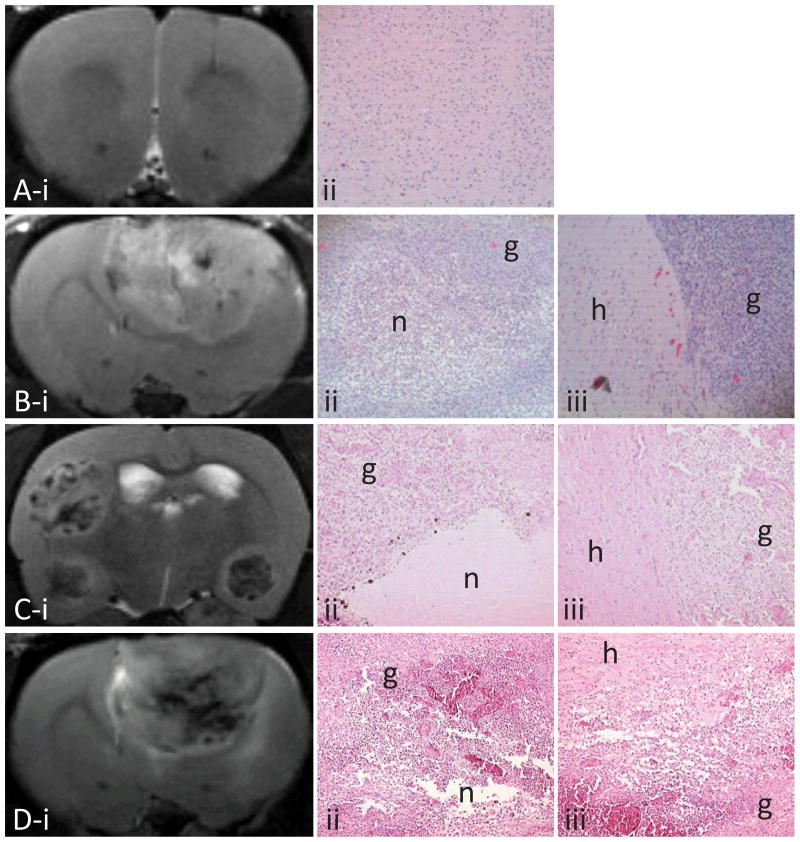
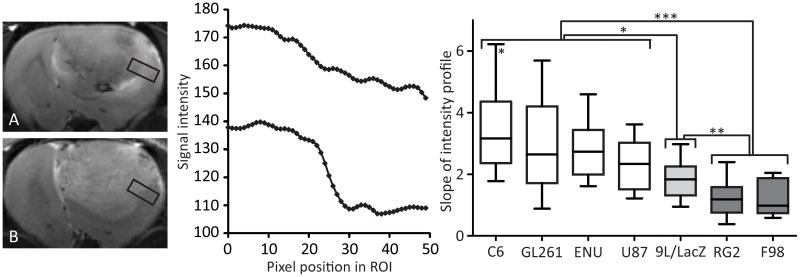
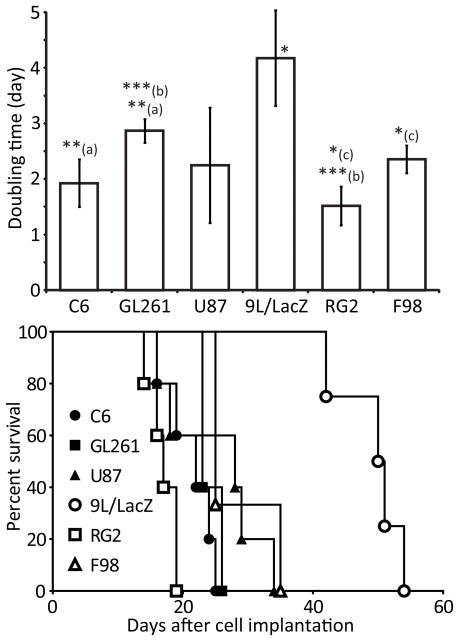
Materials and methods: Intracerebral tumor cell implantation and chemical induction methods were implemented to obtain rat C6, 9L/LacZ, F98, RG2, and ethyl-nitrosourea (ENU) -induced glioma models, a human U87 MG tumor model as well as a mouse GL261 glioma model. MR assessments were regularly conducted on a 7 Tesla Bruker BioSpin system. The tumor border sharpness and growth characteristics of each glioma model were assessed from T(2)-weighted images. Neovascularization and vascular alterations inherent to each model were characterized by assessing absolute blood volumes, vessel density, length, and diameter using Mathematica and Amira software.

Results: The 9L/LacZ and ENU gliomas both presented flaws that hinder their use as reliable brain tumor models. C6 gliomas were slightly invasive and induced moderate vascular alterations, whereas GL261 tumors dramatically altered the brain vessels in the glioma region. F98, RG2, and U87 are infiltrative models that produced dramatic vascular alterations.

Conclusion: MRI and MRA provided crucial in vivo information to identify a distinctive "fingerprint" for each of our seven rodent glioma models.


Figures

Figure 1
Figure 1
Representative T2-weighted images taken at various days after cell implantation (panel i) and corresponding H&E (x 10) showing necrotic (n, for areas of very low or null glioma cell density) and glioma tissue (g, ii) and the peritumoral region (healthy tissue, h, iii): rat injected with primary astrocytes at day 21 (A), C6 glioma at day 18 (B), ENU glioma at week 34 (C) and RG2 glioma at day 17 (D).
Figure 2
Figure 2
T2-weighted images of a RG2 (panel A) and C6 (panel B) gliomas, with corresponding pixel intensity profiles taken in the peritumoral region (a ROI is shown as a black rectangle). The slope between C6 tumor (high-intensity pixels) and healthy (lower intensity pixels) tissue is sharp (bottom), whereas an infiltrative RG2 glioma presents a more gradual intensity change (top). Panel C represents the slopes of the intensity profiles for each glioma model, calculated at the last MRI time point (about 23 days after cell implantation for the orthotopic implantation models and at 30 weeks of age for the ENU induction model). The data are represented as 10–90 percentile. (*) p < 0.05 between any glioma from the “white” group and the 9L/LacZ model, and between the C6 and the U87 models; (**) p < 0.01 between 9L/LacZ tumors and the tumors from the “dark grey” group; (***) p < 0.001 between the “white” and the “dark grey” groups.
Figure 3
Figure 3
Time needed by each glioma model to double in size (top) and survival curves of each group (bottom). The doubling time data are represented as the mean ± standard deviation. * p < 0.05 between the 9L/LacZ tumors and all other models, and between (c) the RG2 and the F98 gliomas; **(a) p < 0.01 between the C6 and the GL261 models; ***(b) p < 0.001 between the GL261 and the RG2 models. For the survival data, * p < 0.05 between the F98 and the C6 models, and between the F98 and the RG2 tumors; ** p < 0.01 between the 9L/LacZ gliomas and all other models.
Figure 4
Figure 4
3D vasculature representations were coregistered with the tumor, rending the ability to identify the altered pre-existing vessels (black arrows) and newly generated vessels (arrowheads). As shown here, they are taken at 30° from the sagittal plane of the brain, for an early and late time point and for representative glioma models presenting different angiogenic behaviors: primary astrocyte-implanted animal (panel A, day 7, left, and day 29, right), C6 (panel B, day 5, left, and day 21, right), U87 (panel C, day 7, left, and day 27, right) and GL261 gliomas (panel D, day 8, left, and day 23, right).
Figure 5
Figure 5
VEGF staining (x 40) representative of normal brain tissue (A) and 3 glioma models: ENU gliomas (B), U87 gliomas (C) and RG2 gliomas (D).

References

    1. CBTRUS. Statistical report: primary brain tumors in the United States, 2000–2004: Central brain tumor registry of the United States. 2008:1–62.
    1. Louis DN, Ohgaki H, Wiestler OD, et al. The 2007 WHO classification of tumours of the central nervous system. Acta neuropathologica. 2007;114:97–109. - PMC - PubMed
    1. Plate KH, Breier G, Weich HA, Risau W. Vascular endothelial growth factor is a potential tumour angiogenesis factor in human gliomas in vivo. Nature. 1992;359:845–848. - PubMed
    1. Gudinaviciene I, Pranys D, Juozaityte E. Impact of morphology and biology on the prognosis of patients with gliomas. Medicina (Kaunas) 2004;40:112–120. - PubMed
    1. Furnari FB, Fenton T, Bachoo RM, et al. Malignant astrocytic glioma: genetics, biology, and paths to treatment. Genes Dev. 2007;21:2683–2710. - PubMed

Publication types