

Depletion of abundant plasma proteins and limitations of plasma proteomics
- PMID: 20677825
- PMCID: PMC2948641
- DOI: 10.1021/pr100646w
Depletion of abundant plasma proteins and limitations of plasma proteomics
Abstract
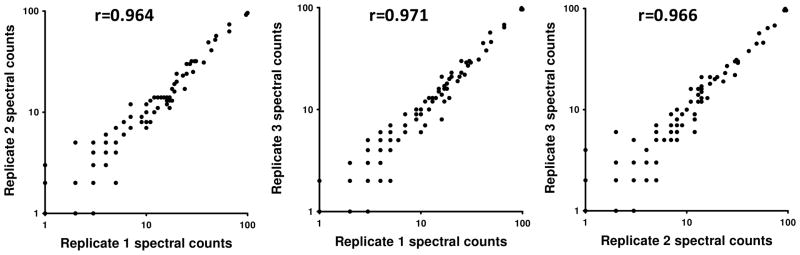
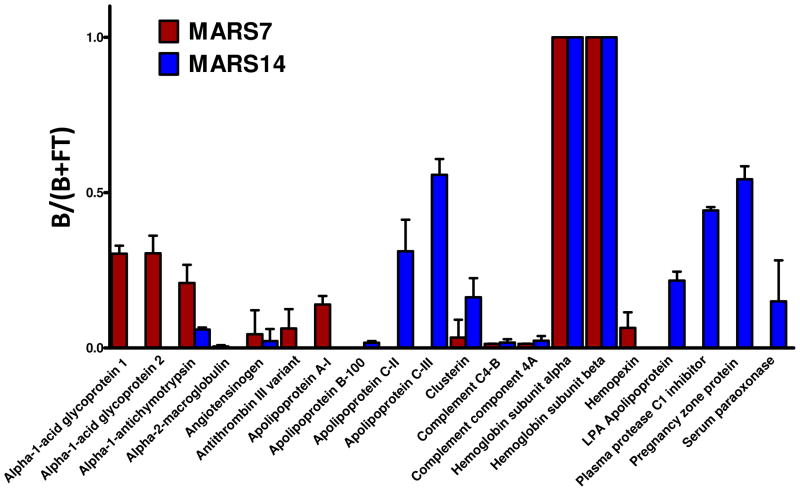
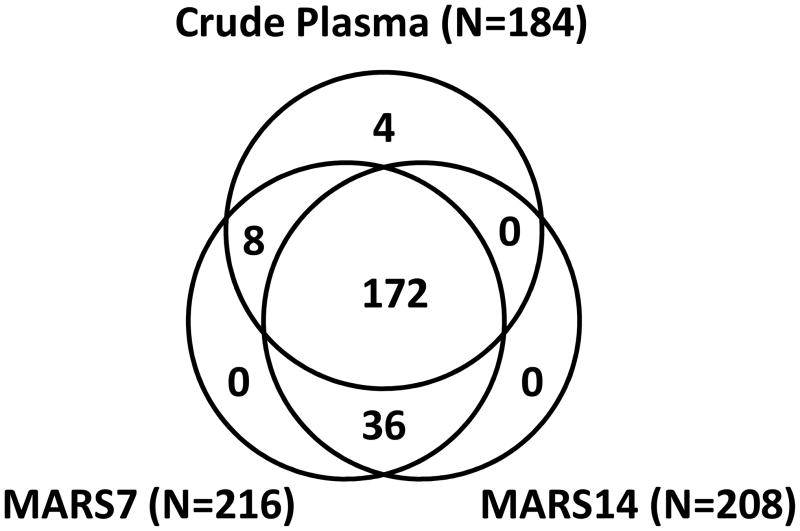
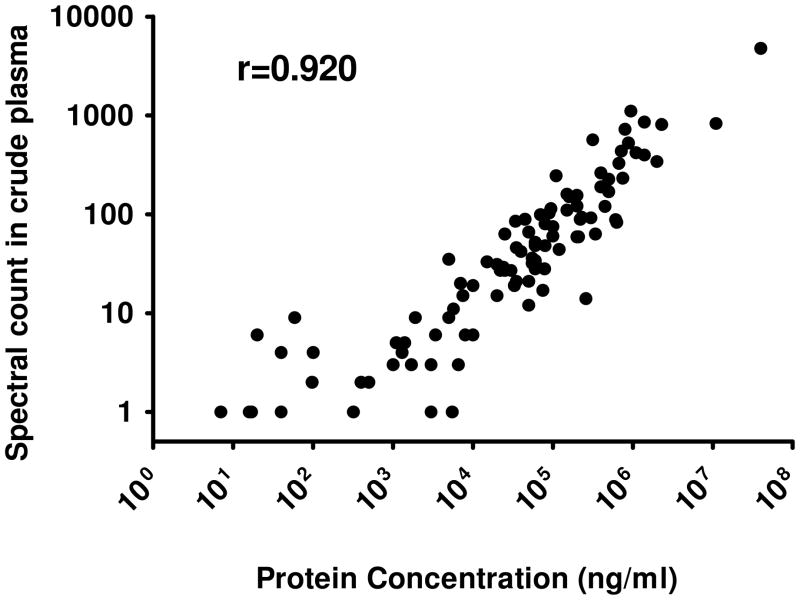
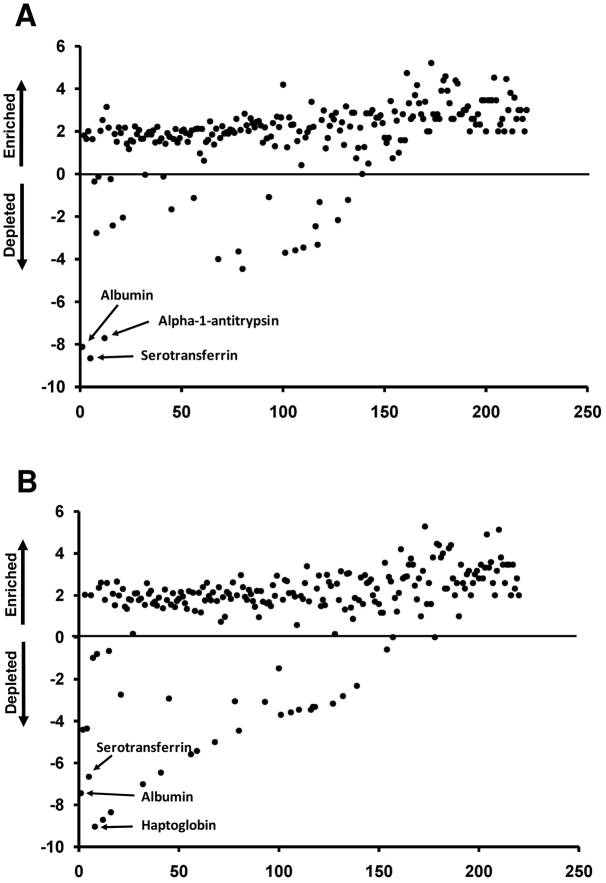
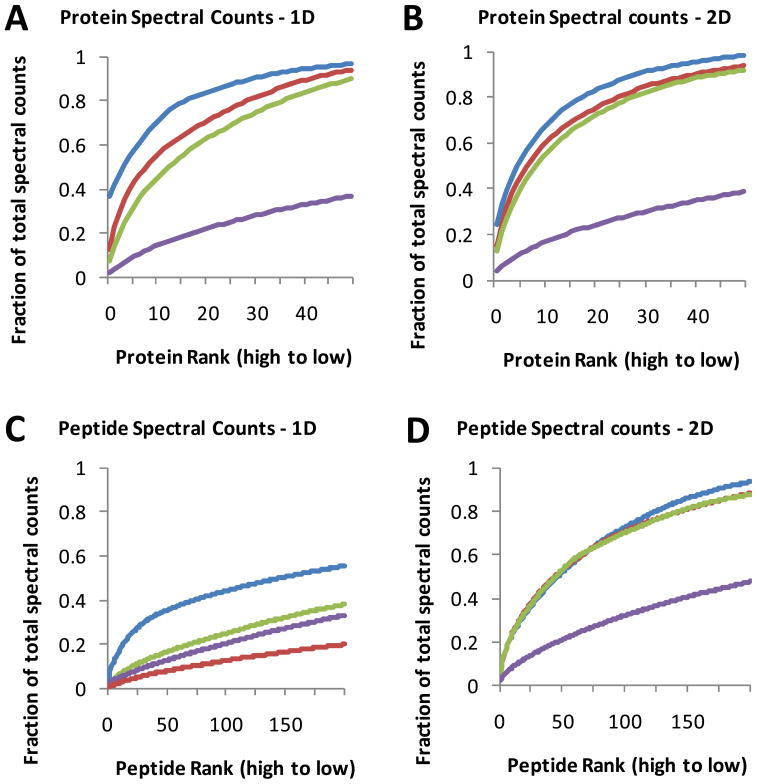
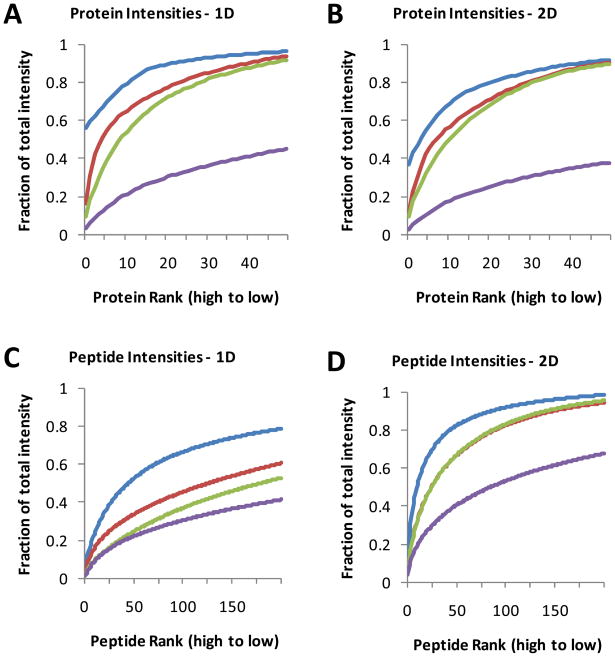
Immunoaffinity depletion with antibodies to the top 7 or top 14 high-abundance plasma proteins is used to enhance detection of lower abundance proteins in both shotgun and targeted proteomic analyses. We evaluated the effects of top 7/top 14 immunodepletion on the shotgun proteomic analysis of human plasma. Our goal was to evaluate the impact of immunodepletion on detection of proteins across detectable ranges of abundance. The depletion columns afforded highly repeatable and efficient plasma protein fractionation. Relatively few nontargeted proteins were captured by the depletion columns. Analyses of unfractionated and immunodepleted plasma by peptide isoelectric focusing (IEF), followed by liquid chromatography-tandem mass spectrometry (LC-MS/MS), demonstrated enrichment of nontargeted plasma proteins by an average of 4-fold, as assessed by MS/MS spectral counting. Either top 7 or top 14 immunodepletion resulted in a 25% increase in identified proteins compared to unfractionated plasma. Although 23 low-abundance (<10 ng mL(-1)) plasma proteins were detected, they accounted for only 5-6% of total protein identifications in immunodepleted plasma. In both unfractionated and immunodepleted plasma, the 50 most abundant plasma proteins accounted for 90% of cumulative spectral counts and precursor ion intensities, leaving little capacity to sample lower abundance proteins. Untargeted proteomic analyses using current LC-MS/MS platforms-even with immunodepletion-cannot be expected to efficiently discover low-abundance, disease-specific biomarkers in plasma.
Figures
References
-
- Anderson NL, Anderson NG. The human plasma proteome: history, character, and diagnostic prospects. Mol Cell Proteomics. 2002;1 (11):845–67. - PubMed
-
- Pieper R, Su Q, Gatlin CL, Huang ST, Anderson NL, Steiner S. Multi-component immunoaffinity subtraction chromatography: An innovative step towards a comprehensive survey of the human plasma proteome. Proteomics. 2003;3 (4):422–432. - PubMed
-
- Pernemalm M, Lewensohn R, Lehtio J. Affinity prefractionation for MS-based plasma proteomics. Proteomics. 2009;9 (6):1420–7. - PubMed
-
- Bjorhall K, Miliotis T, Davidsson P. Comparison of different depletion strategies for improved resolution in proteomic analysis of human serum samples. Proteomics. 2005;5 (1):307–17. - PubMed
-
- Desrosiers RR, Beaulieu E, Buchanan M, Beliveau R. Proteomic analysis of human plasma proteins by two-dimensional gel electrophoresis and by antibody arrays following depletion of high-abundance proteins. Cell Biochem Biophys. 2007;49 (3):182–95. - PubMed
Publication types
MeSH terms
Substances
Grants and funding
LinkOut - more resources
Full Text Sources
Other Literature Sources
