. 2010 Aug 2:7:62.
doi: 10.1186/1742-4690-7-62.

Functional interaction between Env oncogene from Jaagsiekte sheep retrovirus and tumor suppressor Sprouty2

Affiliations

Functional interaction between Env oncogene from Jaagsiekte sheep retrovirus and tumor suppressor Sprouty2

Ebenezer Chitra et al. Retrovirology. .

Abstract

Background: Jaagsiekte sheep retrovirus (JSRV) is a type D retrovirus capable of transforming target cells in vitro and in vivo. The Envelope (Env) gene from JSRV and from related retroviruses can induce oncogenic transformation, although the detailed mechanism is yet to be clearly understood. Host cell factors are envisaged to play a critical determining role in the regulation of Env-mediated cell transformation.

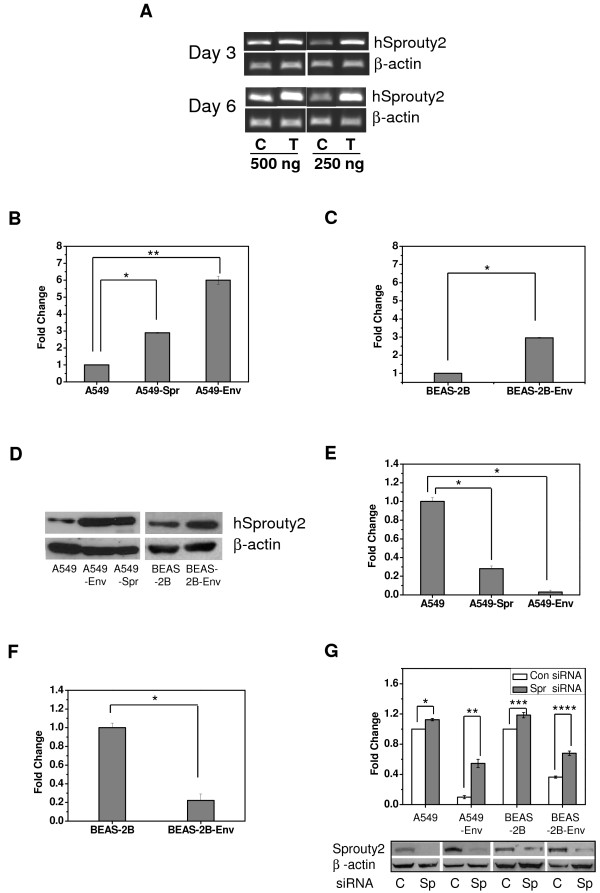
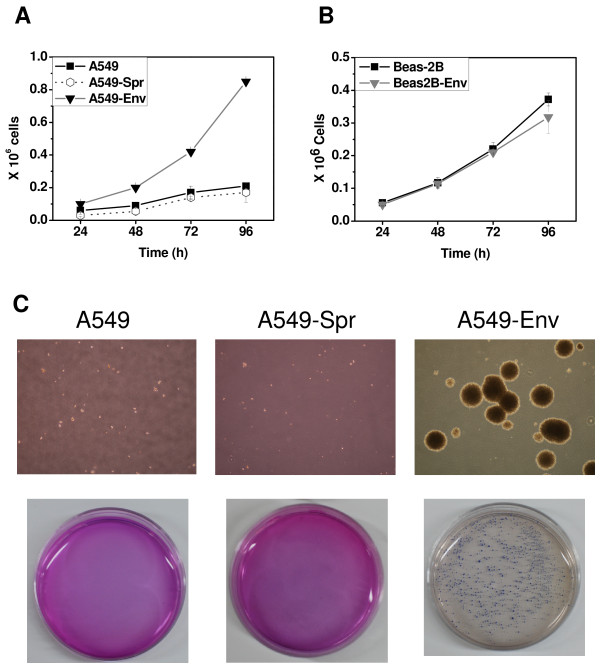
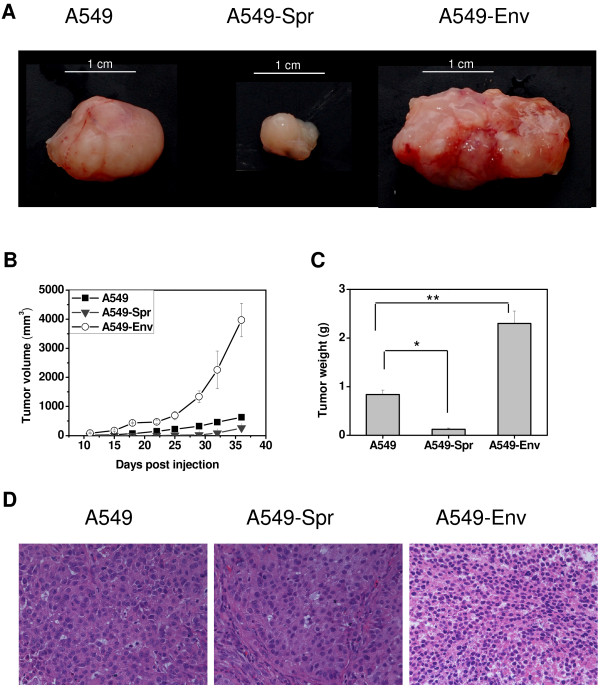
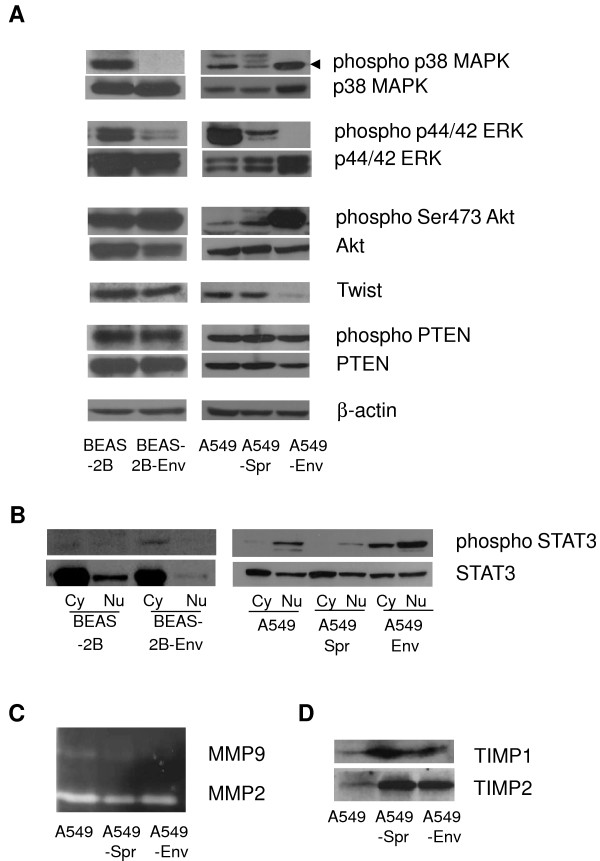
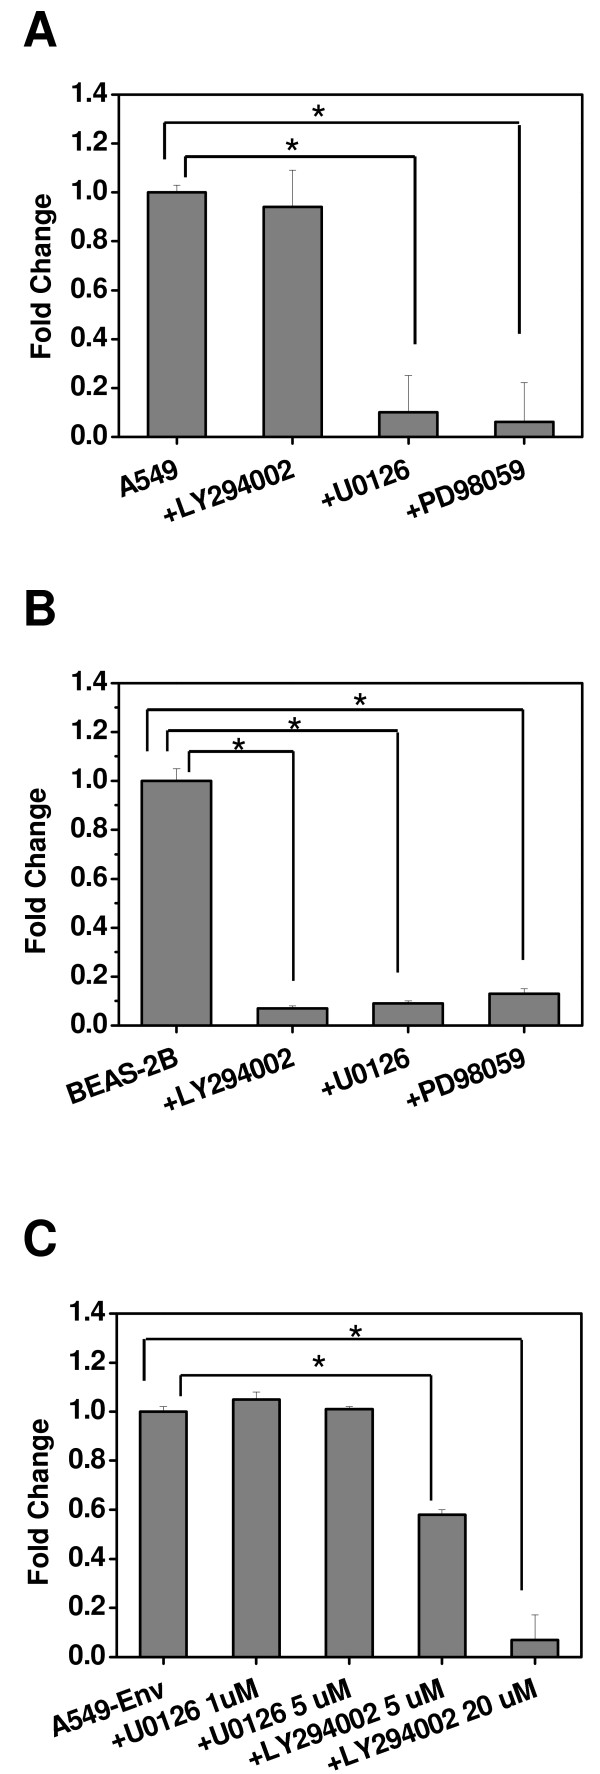
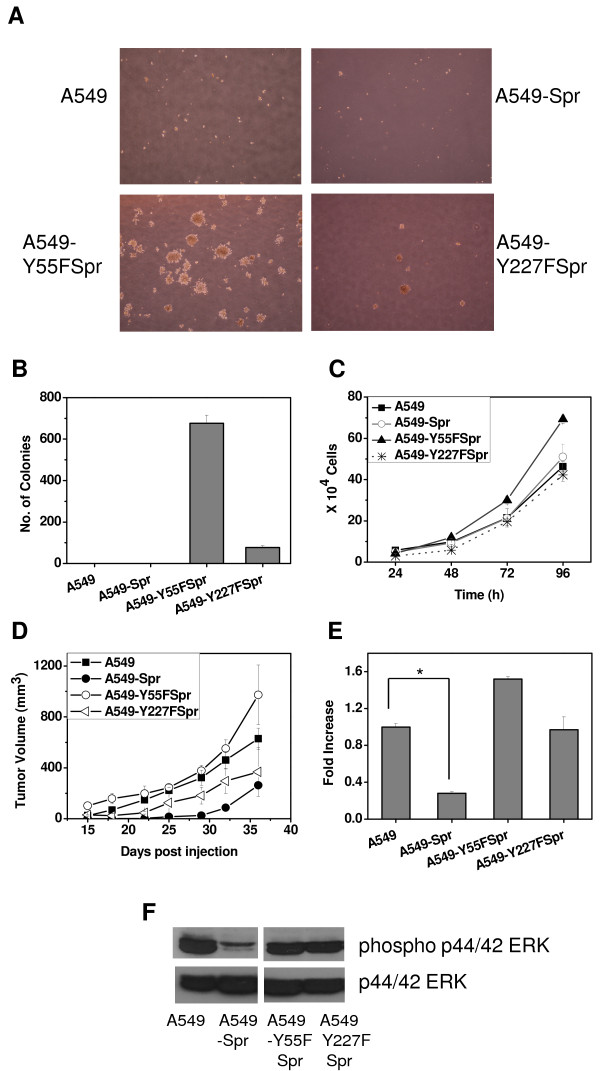
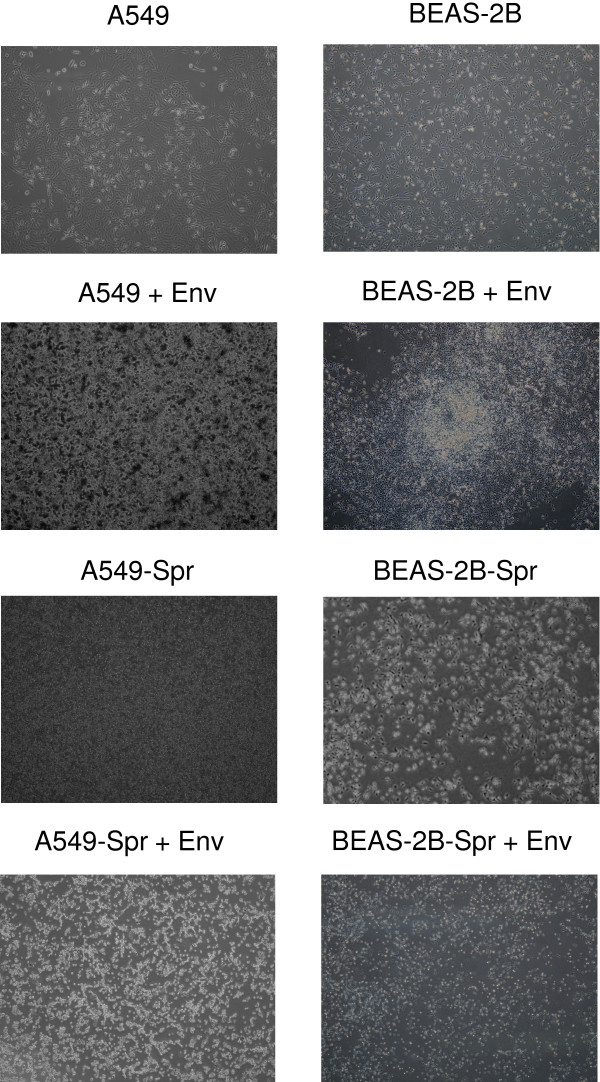
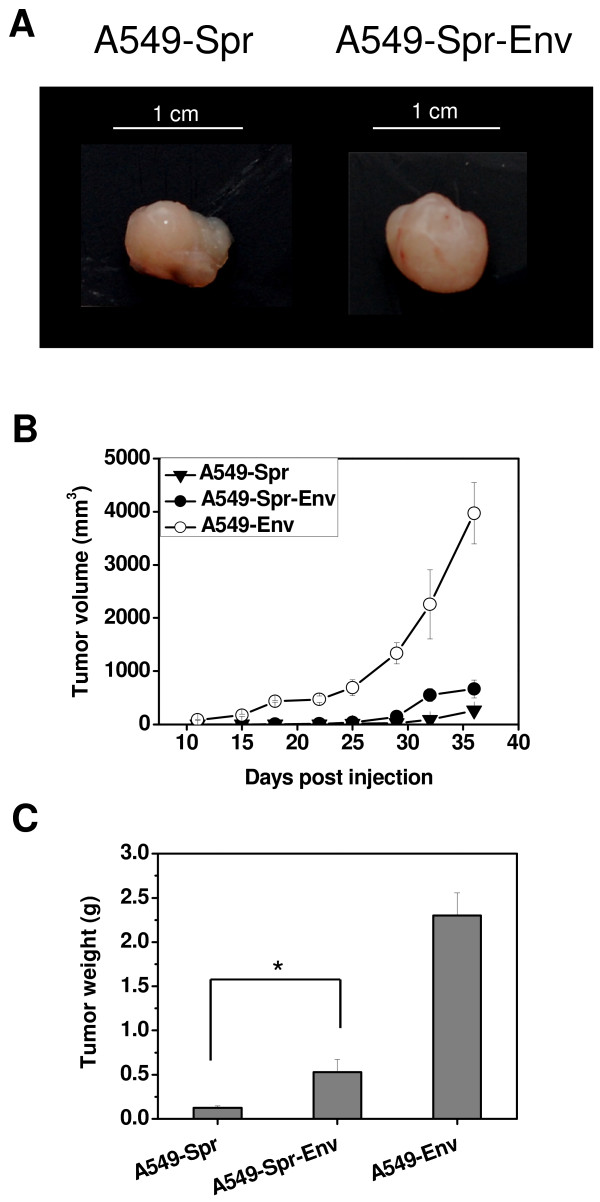
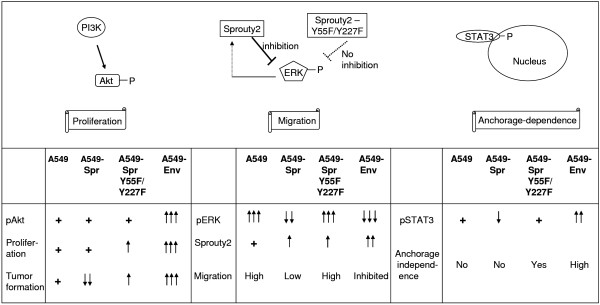
Results: JSRV Env-mediated transformation of a lung adenocarcinoma cell line induced rapid proliferation, anchorage-independent growth and tumor formation, but completely abrogated the migration ability. An analysis of the signaling scenario in the transformed cells suggested the involvement of the ERK pathway regulated by Sprouty2 in cell migration, and the PI3K-Akt and STAT3 pathways in proliferation and anchorage-independence. On the other hand, in a normal lung epithelial cell line, Env-mediated transformation only decreased the migration potential while the other functions remained unaltered. We observed that Env induced the expression of a tumor suppressor, Sprouty2, suggesting a correlation between Env-effect and Sprouty2 expression. Overexpression of Sprouty2 per se not only decreased the migratory potential and tumor formation potential of the target cells but also made them resistant to subsequent Env-mediated transformation. On the other hand, over expression of the functional mutants of Sprouty2 had no inhibitory effect, confirming the role of Sprouty2 as a tumor suppressor.

Conclusions: Our studies demonstrate that Env and Sprouty2 have a functional relationship, probably through shared signaling network. Sprouty2 functions as a tumor suppressor regulating oncogenic transformation of cells, and it therefore has the potential to be exploited as a therapeutic anti-cancer agent.


Figures

Figure 1
Figure 1
Induction of Sprouty2 and inhibition of cell migration in JSRV Env transformed cells. (A) A549 cells were transfected with a plasmid carrying JSRV Env gene (T) or the empty vector (C), and the expression of Sprouty2 and β-actin was monitored on days 3 and 6 post transfection by RT-PCR using different template concentrations (500 ng and 250 ng). Data represent two independent experiments. (B) and (C) Quantitative RT-PCR analysis depicting the fold increase in Sprouty2 mRNA levels in the stable cell lines A549-Spr and A549-Env compared to A549 (*P < 0.0007, **P < 0.0001) (B) and in BEAS-2B-Env compared to BEAS-2B (C) *P < 0.0001. (D) Western blot analysis of the expression of Sprouty2 protein and β-actin in stably transformed cell lines compared to the parental cell lines. Data represent five independent experiments. (E) and (F) Cell migration assay: Equal number of A549, A549-Spr and A549-Env cells (E) or BEAS-2B and BEAS-2B-Env cells (F) were allowed to migrate across the 8 μm porous membrane in a Boyden chamber in response to serum. After 15 h, the migrated cells were fixed, stained and counted (*P < 0.0001). (G) The effect of 200 pmoles of Sprouty2-specific siRNA on the migration ability of A549, A549-Env, BEAS-2B and BEAS-2B-Env cells compared to control siRNA (*P = 0.014, **P = 0.0169, ***P = 0.034, ****P = 0.0111). Corresponding changes in Sprouty2 protein levels compared to β-actin control are depicted in the Western blot shown below the bar diagram for the respective cell lines. (C) indicates control siRNA and (Sp) indicates Sprouty2 siRNA. Data represent two independent experiments.
Figure 2
Figure 2
JSRV Env induces proliferation and colony formation in A549-Env cells. (A and B) Equal number (1 × 10⁵ cells/well) of A549, A549-Spr and A549-Env cells (A) or BEAS-2B and BEAS-2B-Env cells (B) were allowed to proliferate for four days and live cells were counted every 24 h. (C) A549, A549-Spr and A549-Env cells were cultured in soft agar to assess their anchorage-independent colony formation ability. The colonies were counted and photographed on day 12.
Figure 3
Figure 3
Env enhances and Sprouty2 inhibits tumor formation in SCID mice. (A) Pictures of in vivo tumors formed by A549, A549-Spr and A549-Env cells injected into the subcutaneous tissue of SCID mice (5-7 mice per group) and excised on day 34. (B) The growth rate of tumors formed by the respective cell lines in SCID mice is represented as increase in tumor volume monitored for up to 5 weeks. (C) Average weight of tumors resected from SCID mice 34 days after injection (*P = 0.0003, **P = 0.0006). (D) Hematoxylin and eosin (H&E) staining of sections of xenografts resected from SCID mice to confirm the presence of malignant cells. Magnification 400×.
Figure 4
Figure 4
Alteration of signal transduction by Env and Sprouty2. (A) Cell lysates were prepared by homogenization of A549, A549-Spr, A549-Env, BEAS-2B and BEAS-2B-Env cells. The proteins were separated on 10% acrylamide gel, transferred to nitrocellulose membrane and probed with various antibodies. The results show the levels of phospho p38 MAPK, p38 MAPK, phospho p44/42 ERK, p44/42 ERK, phospho Ser473 Akt, Akt, TWIST, phospho PTEN, PTEN and β-actin in the indicated cell lines. (B) Proteins were extracted from cytoplasmic (cy) and nuclear (nu) fractions of the cells and the levels of phospho STAT3 and STAT3 were ascertained by Western blot. (C) MMP Zymogram: Conditioned media obtained from the cell lines was assayed for gelatinase activity using 10% SDS-PAGE gel to estimate MMP activity. (D) Conditioned media obtained from the cell lines was concentrated; the secreted proteins were separated by SDS-PAGE and immunoblotted with antibodies against TIMP1 and TIMP2.
Figure 5
Figure 5
ERK and PI3K pathways regulate cell migration and proliferation. A549 (A) or BEAS-2B (B) cells were allowed to migrate across the 8 μm porous membrane in a Boyden chamber either alone or in the presence of PI3K inhibitor LY294002 (20 μM) or MEK inhibitors U0126 (20 μM) or PD98059 (20 μM) in response to serum. After 15 h, the migrated cells were fixed, stained and counted. (A) *P < 0.0001; (B) *P < 0.0003). (C) A549-Env cells were allowed to proliferate either alone or in the presence of MEK inhibitor U0126 (1 μM) or (5 μM) or PI3K inhibitor LY294002 (5 μM) or (20 μM). Data shown represent proliferation at 72 h. (*P < 0.0001).
Figure 6
Figure 6
Tyrosine mutants of Sprouty2 inhibit its tumor suppressive function. Stable transfectants of A549 over expressing either Y55F or Y227F mutant of Sprouty2 designated A549-Y55FSpr and A549-Y227FSpr respectively were created and assayed for their functional properties. (A) and (B) Colony formation assay: A549, A549-Y55FSpr and A549-Y227FSpr cells were cultured in soft agar to assess their anchorage-independent colony formation ability. (A) The colonies were counted and photographed on day 12. (B) Graphical representation of the number of colonies formed by each cell line. (C) Equal numbers (1 × 10⁵ cells/well) of A549, A549-Y55FSpr and A549-Y227FSpr cells were allowed to proliferate for four days. Schematic representation of their proliferation rate represented by live cell count every 24 h. (D) In vivo tumor formation: A549, A549-Spr or A549-Y55FSpr or A549-Y227FSpr cells were injected into the subcutaneous tissue of SCID mice. Growth rate of tumors formed by the respective cell lines in SCID mice is represented as increase in tumor volume monitored for up to 5 weeks. (E) Migration assay: Cells were allowed to migrate across the 8 μm porous membrane in a Boyden chamber in response to serum. After 15 h, the migrated cells were fixed, stained and counted. (*P = 0.0029). (F) Western blot analysis of the cell lysates of A549, A549-Spr, A549-Y55FSpr and A549-Y227FSpr to check for the levels of phospho ERK p44/42 and total ERK p44/42.
Figure 7
Figure 7
Sprouty2 overexpressing cells are resistant to Env-mediated transformation. A549, A549-Spr, BEAS-2B and BEAS-2B-Spr cells were transfected with the plasmid carrying Env gene by standard calcium chloride method. Foci formation after 14 days was monitored and photographed at 10× magnification.
Figure 8
Figure 8
A549-Spr-Env cells lack enhanced tumor forming potential in vivo. (A) Pictures of in vivo tumors formed by A549-Spr and A549-Spr-Env cells injected into the subcutaneous tissue of SCID mice and excised on day 34. (B) Growth rates of the tumors formed by the respective cell lines in SCID mice represented as tumor volume monitored for up to 5 weeks. (C) Average weight of tumors resected from SCID mice 34 days after injection. (*P = 0.0369).
Figure 9
Figure 9
Schematic diagram representing the alteration of signaling network by Sprouty2 and Env. Schematic diagram represents the interaction of signaling molecules and their proposed physiological outcomes. The levels of phospho Akt, phospho ERK, Sprouty2 and phospho STAT3 in the cell lines A549, A549-Spr, A549-Y55FSpr/A549-Y227FSpr and A549-Env are represented. ↑ indicates upregulation, ↓ indicates downregulation, + indicates presence without any increase or decrease. The functional outcomes in terms of proliferation, tumor formation, migration and anchorage-independent colony formation in the above mentioned cell lines are also represented.

Similar articles

Cited by

References

    1. Maeda N, Fan H, Yoshikai Y. Oncogenesis by retroviruses: old and new paradigms. Rev Med Virol. 2008;18:387–405. doi: 10.1002/rmv.592. - DOI - PubMed
    1. Maeda N, Fan H. Signal transduction pathways utilized by enzootic nasal tumor virus (ENTV-1) envelope protein in transformation of rat epithelial cells resemble those used by jaagsiekte sheep retrovirus. Virus Genes. 2008;36:147–155. doi: 10.1007/s11262-007-0193-x. - DOI - PubMed
    1. Wootton SK, Halbert CL, Miller AD. Sheep retrovirus structural protein induces lung tumours. Nature. 2005;434:904–907. doi: 10.1038/nature03492. - DOI - PMC - PubMed
    1. Chitra E, Yu SL, Hsiao KN, Shao HY, Sia C, Chen IH, Hsieh SY, Chen JH, Chow YH. Generation and characterization of JSRV envelope transgenic mice in FVB background. Virology. 2009;393:120–126. doi: 10.1016/j.virol.2009.07.023. - DOI - PubMed
    1. Verwoerd DW, Payne AL, York DF, Myer MS. Isolation and preliminary characterization of the jaagsiekte retrovirus (JSRV) Onderstepoort J Vet Res. 1983;50:309–316. - PubMed

Publication types

Substances

LinkOut - more resources