. 2010;11(8):R80.
doi: 10.1186/gb-2010-11-8-r80. Epub 2010 Aug 3.

Comprehensive transcriptome analysis of mouse embryonic stem cell adipogenesis unravels new processes of adipocyte development

Affiliations

Comprehensive transcriptome analysis of mouse embryonic stem cell adipogenesis unravels new processes of adipocyte development

Nathalie Billon et al. Genome Biol. 2010.

Abstract

Background: The current epidemic of obesity has caused a surge of interest in the study of adipose tissue formation. While major progress has been made in defining the molecular networks that control adipocyte terminal differentiation, the early steps of adipocyte development and the embryonic origin of this lineage remain largely unknown.

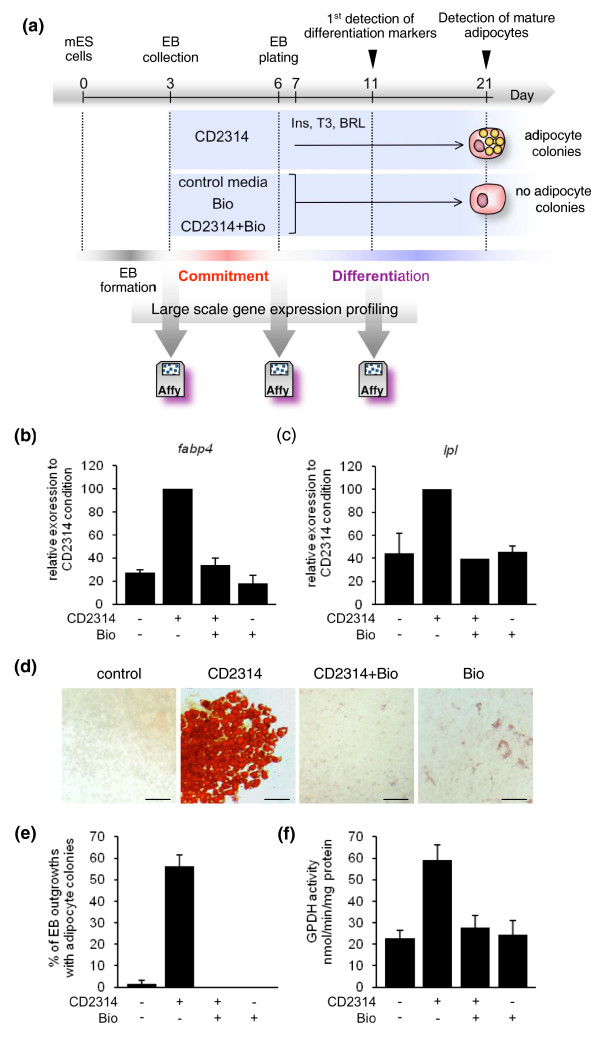
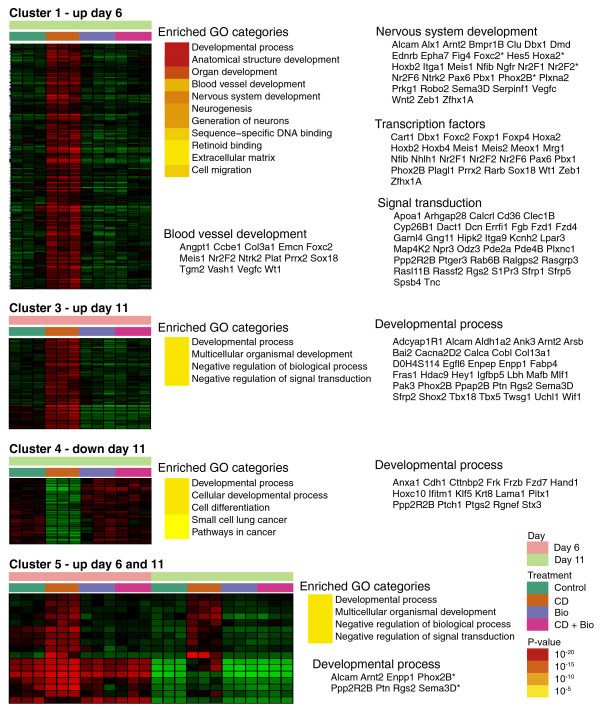
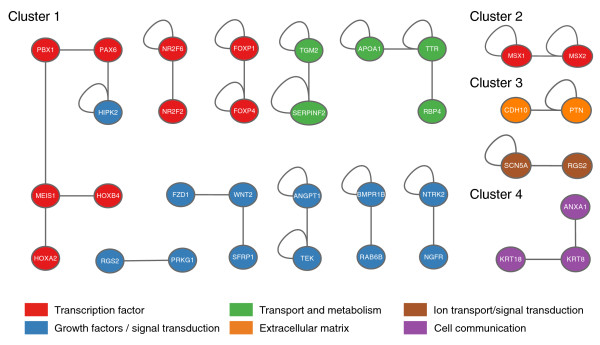
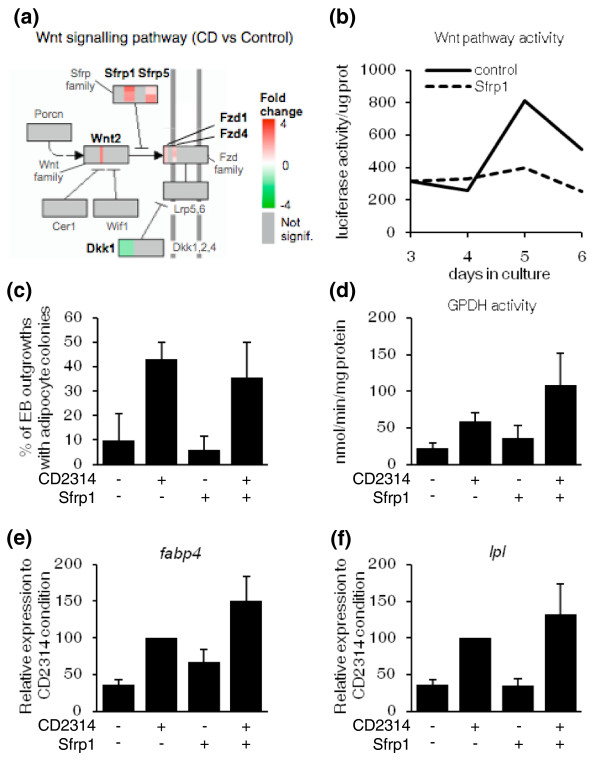
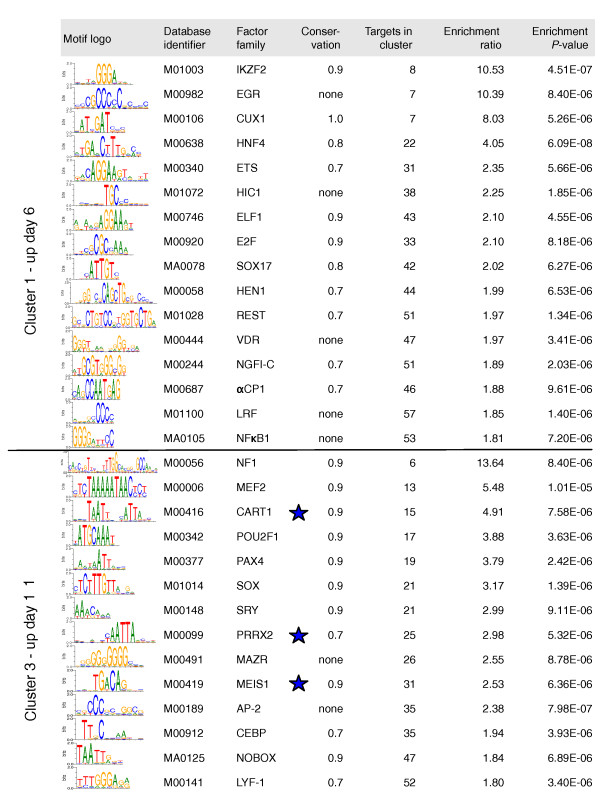
Results: Here we performed genome-wide analysis of gene expression during adipogenesis of mouse embryonic stem cells (ESCs). We then pursued comprehensive bioinformatic analyses, including de novo functional annotation and curation of the generated data within the context of biological pathways, to uncover novel biological functions associated with the early steps of adipocyte development. By combining in-depth gene regulation studies and in silico analysis of transcription factor binding site enrichment, we also provide insights into the transcriptional networks that might govern these early steps.

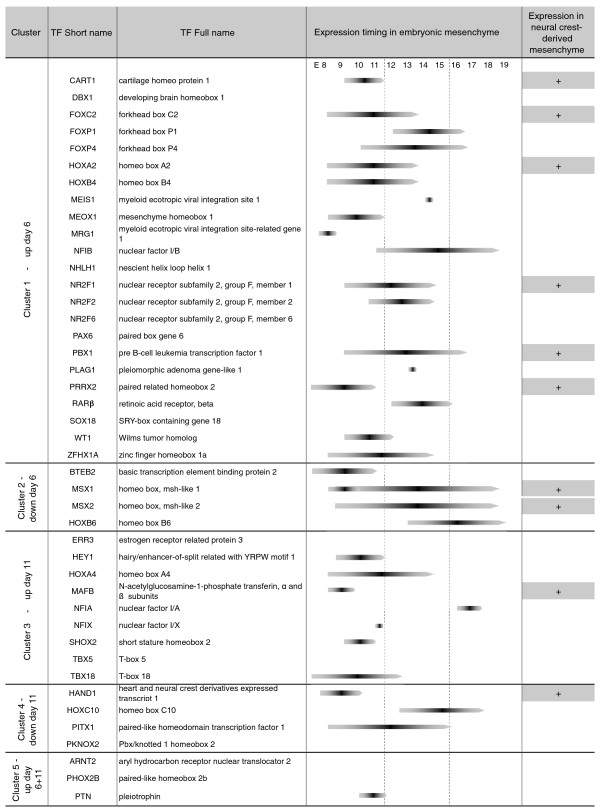
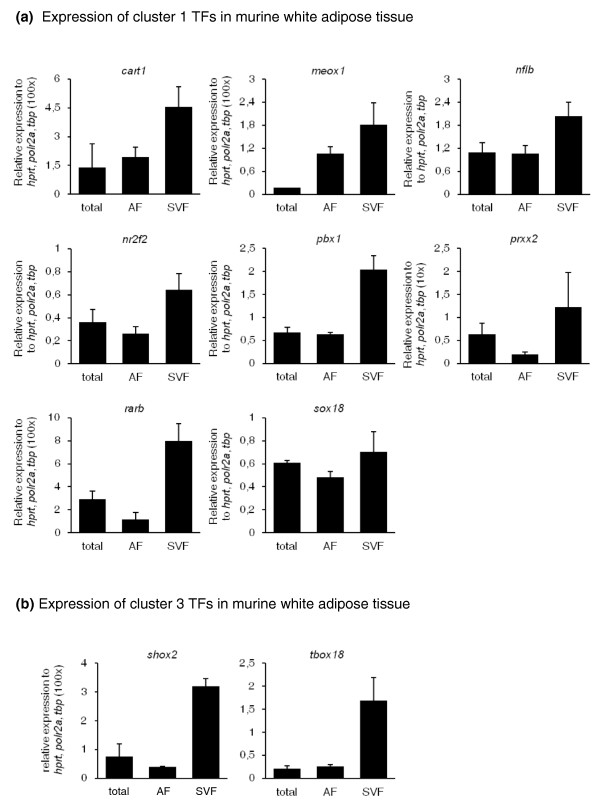
Conclusions: This study supports several biological findings: firstly, adipocyte development in mouse ESCs is coupled to blood vessel morphogenesis and neural development, just as it is during mouse development. Secondly, the early steps of adipocyte formation involve major changes in signaling and transcriptional networks. A large proportion of the transcription factors that we uncovered in mouse ESCs are also expressed in the mouse embryonic mesenchyme and in adipose tissues, demonstrating the power of our approach to probe for genes associated with early developmental processes on a genome-wide scale. Finally, we reveal a plethora of novel candidate genes for adipocyte development and present a unique resource that can be further explored in functional assays.


Figures

Figure 1
Figure 1
Experimental strategy used for large-scale gene expression profiling of mESC adipogenesis. (a) Summary scheme of our experimental design. Adipocyte commitment was selectively stimulated through exposure of EBs to CD2314, or repressed through the addition of the GSK3 inhibitor BIO, or both compounds, between day 3 and day 6. Adipocyte terminal differentiation was further induced by addition of the adipogenic compounds insulin (Ins), triiodothyronine (T3), and rosiglitazone (BRL) from day 7 to day 21. For microarray analysis, samples were generated before (day 3), right after (day 6), or 5 days after (day 11) exposure to control medium, CD2314, BIO, or CD2314+BIO and analyzed using Mouse Genome 430 2.0 Affymetrix Arrays. Expression of adipocyte differentiation markers could first be detected at day 11, while mature adipocytes were detected at day 21. (b, c) Quantification of Fabp4 or Lpl RNA expression by quantitative PCR at day 11. The relative expression level of each RNA upon CD2314 stimulation was considered as 100%. (d) Oil red O staining of mature adipocyte colonies at day 21. Scale bar: 50 μM. (e) Quantification of the percentage of EB outgrowths with adipocyte colonies at day 21. (f) Quantification of glycerol-phosphate dehydrogenase (GPDH) activity at day 21. Here and in the following figures, data are displayed as mean values ± standard error of the mean of at least three independent experiments.
Figure 2
Figure 2
Functional annotation and Gene Ontology category enrichment in mESC adipogenesis-associated genes. Functional annotation and enrichment of GO categories in clusters 1 to 5. Heatmap diagrams with time points and treatments are represented on the left. Hypergeometric GO enrichment P-values reported by g:Profiler are represented using a yellow-to-brown color scale. All the statistically significant results are shown, with the exception of cluster 1, where we picked only the most relevant GO categories out of all significant results. For some GO categories, we also point out the corresponding genes within the cluster. Genes related to neural crest development are indicated with an asterisk. Note that no significant enrichments were detected for cluster 2 (down-regulated genes, day 6).
Figure 3
Figure 3
Protein-protein interaction in mESC adipogenesis-associated clusters. Modules of interacting proteins found in clusters 1 to 5, as detected by GraphWeb software. Colored circles represent proteins and gray lines denote physical PPIs, while circular loops denote interactions within the same species of molecules (for example, homodimers). Nodes are colored according to the functional role of corresponding proteins.
Figure 4
Figure 4
Status of the Wnt pathway and effect of exogenous addition of sFRP-1 during mESC adipogenesis. (a) Stationary view of the KEGG canonical Wnt signaling pathway at day 6 of mESC differentiation in cells treated with CD2314 compared to untreated cells. Genes in the pathway are represented as colored rectangles, each stripe within a rectangle representing one gene member of the same family. Fold changes in RNA levels in the CD2314 condition compared to untreated control determine the colors on a red-to-green scale, with red meaning induction, green meaning repression, and grey meaning no significant variation. (b) Wnt pathway activity in differentiating mESCs stably transfected with the TOP-FLASH reporter construct. EBs were left untreated (control, solid line) or incubated with 100 ng/ml of recombinant sFRP-1 (secreted frizzled-related protein-1; dashed line) from days 3 to 6. (c-f) Effect of exogenous addition of sFRP-1 on adipocyte development. EBs were incubated with CD2314 and sFRP-1, alone or in combination, from days 3 to 6, and adipocyte development was assessed as in Figure 1.
Figure 5
Figure 5
Analysis of the expression of mESC adipogenesis-associated TFs in embryonic mesenchyme. CD2314-modulated TF-encoding genes were extracted from clusters 1 to 5 and their expression was checked in embryonic mesenchyme using the Mouse Genome Informatics web tool. When available, indications about their timing of expression in embryonic mesenchyme, and their prevalence in neural-crest-derived mesenchyme, are also shown. E, embryonic day.
Figure 6
Figure 6
Expression of mESC adipogenesis-associated TFs in murine white adipose tissue. (a, b) TFs whose expression was upregulated by CD2314 during mESC adipogenesis were selected from cluster 1 (a) and from cluster 3 (b) and their expression was then checked by qPCR in total or fractionated periepidymal WAT isolated from 10-week-old mice. For simplicity, for those genes whose relative expression was weaker than the reference genes, relative expression values were multiplied by 10 or 100 as indicated on the y-axis.
Figure 7
Figure 7
Statistically over-represented TFBSs in CD2315-regulated gene promoters. In silico analysis was performed to predict TFBS enrichment in clusters 1 to 5. The motifs with identifiers starting with M0 and MA0 are from TRANSFAC and JASPAR databases, respectively. For each motif, information is given about the TF family known to bind this motif, the conservation level that gave the best over-representation, the number of gene promoters displaying the motif in the cluster, the number of times the motif was enriched from the comparison with all other murine gene promoters, and the P-value before Bonferroni correction. TFs that were also differentially expressed during mESC adipogenesis are marked with stars.

References

    1. Green H, Kehinde O. Spontaneous heritable changes leading to increased adipose conversion in 3T3 cells. Cell. 1976;7:105–113. doi: 10.1016/0092-8674(76)90260-9. - DOI - PubMed
    1. Green H, Kehinde O. An established preadipose cell line and its differentiation in culture. II. Factors affecting the adipose conversion. Cell. 1975;5:19–27. doi: 10.1016/0092-8674(75)90087-2. - DOI - PubMed
    1. Negrel R, Grimaldi P, Ailhaud G. Establishment of preadipocyte clonal line from epididymal fat pad of ob/ob mouse that responds to insulin and to lipolytic hormones. Proc Natl Acad Sci USA. 1978;75:6054–6058. doi: 10.1073/pnas.75.12.6054. - DOI - PMC - PubMed
    1. Tang W, Zeve D, Suh JM, Bosnakovski D, Kyba M, Hammer RE, Tallquist MD, Graff JM. White fat progenitor cells reside in the adipose vasculature. Science. 2008;322:583–586. doi: 10.1126/science.1156232. - DOI - PMC - PubMed
    1. Rodeheffer MS, Birsoy K, Friedman JM. Identification of white adipocyte progenitor cells in vivo. Cell. 2008;135:240–249. doi: 10.1016/j.cell.2008.09.036. - DOI - PubMed

Publication types

Substances