

Cardiac overexpression of insulin-like growth factor 1 attenuates chronic alcohol intake-induced myocardial contractile dysfunction but not hypertrophy: Roles of Akt, mTOR, GSK3beta, and PTEN
- PMID: 20678571
- PMCID: PMC2947341
- DOI: 10.1016/j.freeradbiomed.2010.07.020
Cardiac overexpression of insulin-like growth factor 1 attenuates chronic alcohol intake-induced myocardial contractile dysfunction but not hypertrophy: Roles of Akt, mTOR, GSK3beta, and PTEN
Abstract
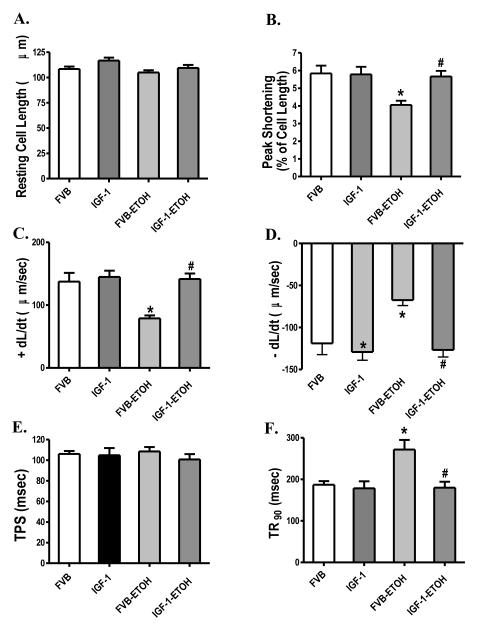
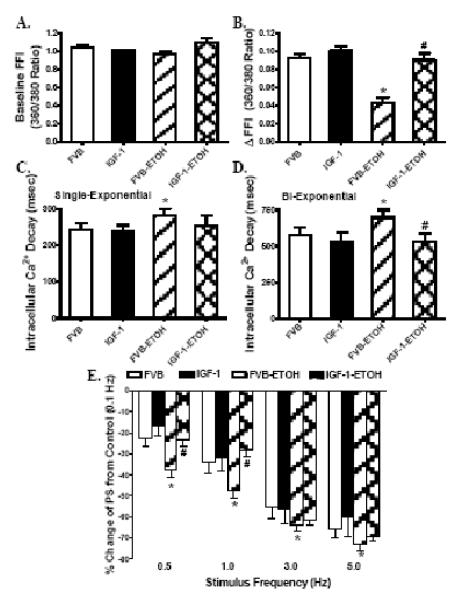
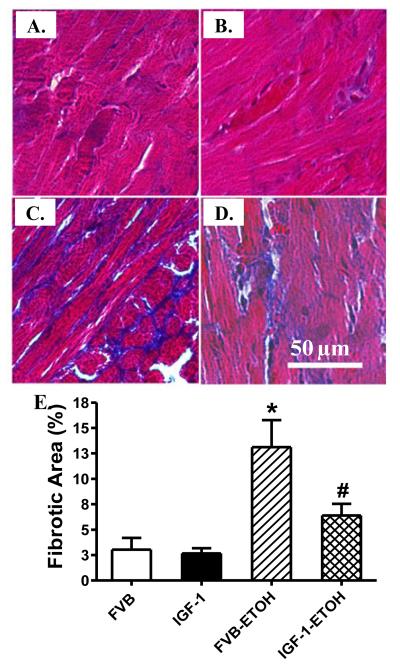
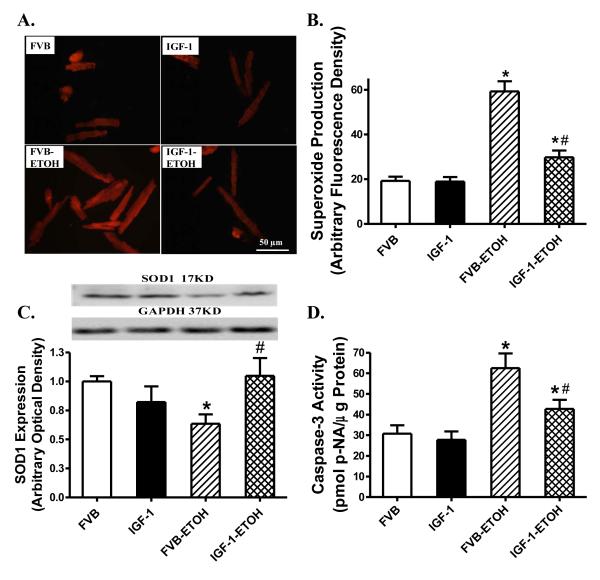
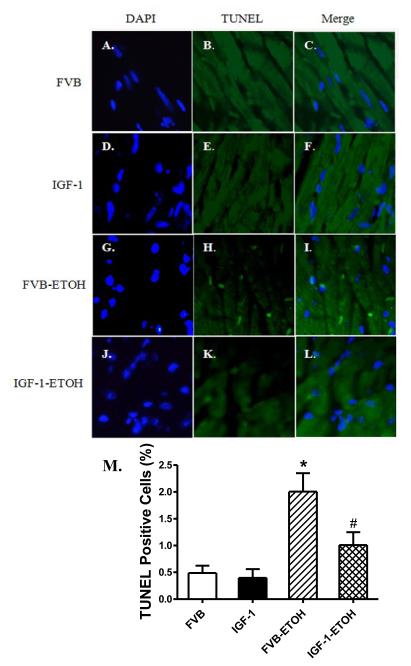
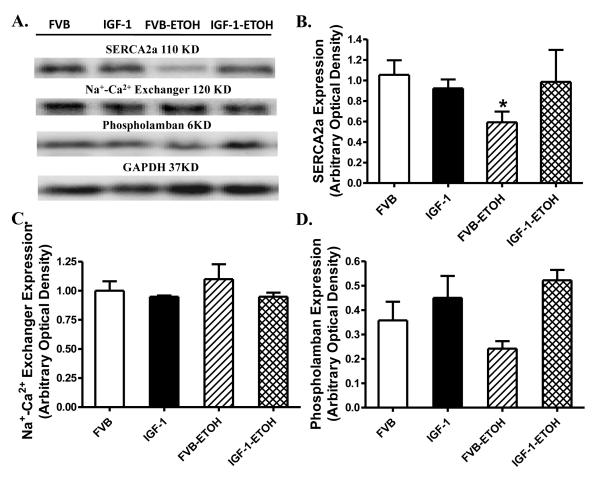
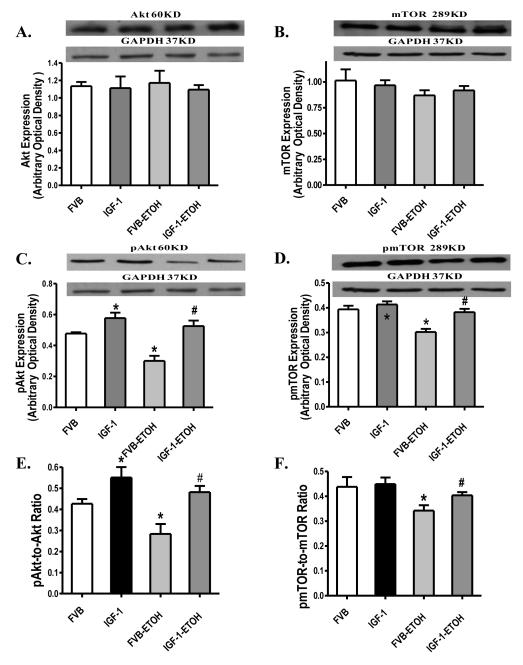
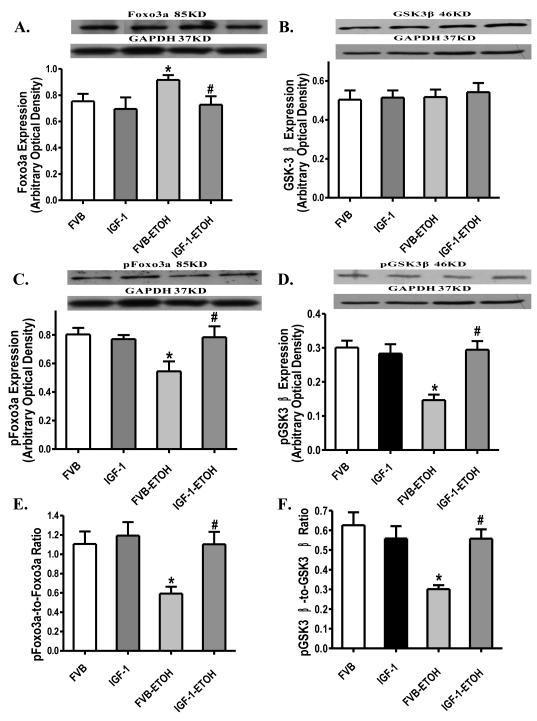
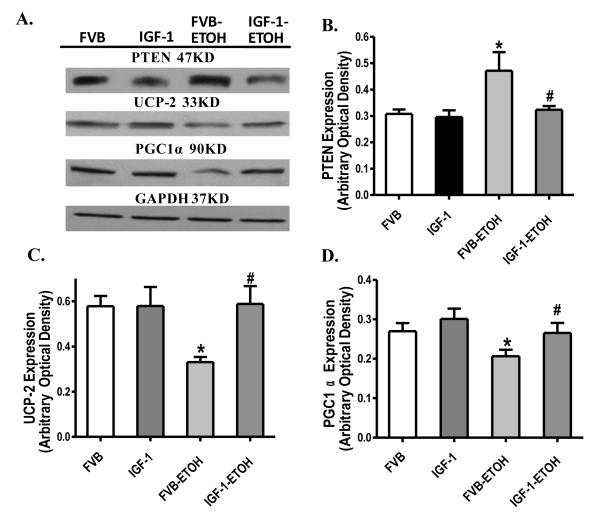
Chronic alcohol intake leads to the development of alcoholic cardiomyopathy manifested by cardiac hypertrophy and contractile dysfunction. This study was designed to examine the effects of transgenic overexpression of insulin-like growth factor 1 (IGF-1) on alcohol-induced cardiac contractile dysfunction. Wild-type FVB and cardiac-specific IGF-1 mice were placed on a 4% alcohol or control diet for 16weeks. Cardiac geometry and mechanical function were evaluated by echocardiography and cardiomyocyte and intracellular Ca(2+) properties. Histological analyses for cardiac fibrosis and apoptosis were evaluated by Masson trichrome staining and TUNEL assay, respectively. Expression and phosphorylation of Cu/Zn superoxide dismutase (SOD1), Ca(2+) handling proteins, and key signaling molecules for survival including Akt, mTOR, GSK3beta, Foxo3a, and the negative regulator of Akt, phosphatase and tensin homolog on chromosome 10 (PTEN), as well as mitochondrial proteins UCP-2 and PGC1alpha, were evaluated by Western blot analysis. Chronic alcohol intake led to cardiac hypertrophy, interstitial fibrosis, reduced mitochondrial number, compromised cardiac contractile function and intracellular Ca(2+) handling, decreased SOD1 expression, elevated superoxide production, and overt apoptosis, all of which, with the exception of cardiac hypertrophy, were abrogated by the IGF-1 transgene. Immunoblotting data showed reduced phosphorylation of Akt, mTOR, GSK3beta, and Foxo3a; upregulated Foxo3a and PTEN; and dampened SERCA2a, PGC1alpha, and UCP-2 after alcohol intake. All these alcohol-induced changes in survival and mitochondrial proteins were alleviated by IGF-1. Taken together, these data favor a beneficial role for IGF-1 in alcohol-induced myocardial contractile dysfunction independent of cardiac hypertrophy.
Copyright 2010 Elsevier Inc. All rights reserved.
Figures


Similar articles
-
Mitochondrial aldehyde dehydrogenase (ALDH2) protects against streptozotocin-induced diabetic cardiomyopathy: role of GSK3β and mitochondrial function.BMC Med. 2012 Apr 23;10:40. doi: 10.1186/1741-7015-10-40. BMC Med. 2012. Retraction in: BMC Med. 2022 Jul 8;20(1):248. doi: 10.1186/s12916-022-02455-5. PMID: 22524197 Free PMC article. Retracted.
-
Chronic Akt activation attenuated lipopolysaccharide-induced cardiac dysfunction via Akt/GSK3β-dependent inhibition of apoptosis and ER stress.Biochim Biophys Acta. 2013 Jun;1832(6):848-63. doi: 10.1016/j.bbadis.2013.02.023. Epub 2013 Mar 6. Biochim Biophys Acta. 2013. PMID: 23474308 Free PMC article.
-
Deficiency of insulin-like growth factor 1 reduces vulnerability to chronic alcohol intake-induced cardiomyocyte mechanical dysfunction: role of AMPK.J Cell Mol Med. 2011 Aug;15(8):1737-46. doi: 10.1111/j.1582-4934.2010.01158.x. J Cell Mol Med. 2011. PMID: 20731752 Free PMC article.
-
The Effects of Ethanol on the Heart: Alcoholic Cardiomyopathy.Nutrients. 2020 Feb 22;12(2):572. doi: 10.3390/nu12020572. Nutrients. 2020. PMID: 32098364 Free PMC article. Review.
-
Regulation of muscle hypertrophy: Involvement of the Akt-independent pathway and satellite cells in muscle hypertrophy.Exp Cell Res. 2021 Dec 15;409(2):112907. doi: 10.1016/j.yexcr.2021.112907. Epub 2021 Nov 15. Exp Cell Res. 2021. PMID: 34793776 Review.
Cited by
-
Inhibition of CYP2E1 attenuates chronic alcohol intake-induced myocardial contractile dysfunction and apoptosis.Biochim Biophys Acta. 2013 Jan;1832(1):128-41. doi: 10.1016/j.bbadis.2012.08.014. Epub 2012 Sep 2. Biochim Biophys Acta. 2013. PMID: 22967841 Free PMC article.
-
Ablation of Akt2 protects against lipopolysaccharide-induced cardiac dysfunction: role of Akt ubiquitination E3 ligase TRAF6.J Mol Cell Cardiol. 2014 Sep;74:76-87. doi: 10.1016/j.yjmcc.2014.04.020. Epub 2014 May 5. J Mol Cell Cardiol. 2014. PMID: 24805195 Free PMC article.
-
Etiology of alcoholic cardiomyopathy: Mitochondria, oxidative stress and apoptosis.Int J Biochem Cell Biol. 2017 Aug;89:125-135. doi: 10.1016/j.biocel.2017.06.009. Epub 2017 Jun 9. Int J Biochem Cell Biol. 2017. PMID: 28606389 Free PMC article. Review.
-
Metformin alleviates ethanol-induced cardiomyocyte injury by activating AKT/Nrf2 signaling in an ErbB2-dependent manner.Mol Biol Rep. 2023 Apr;50(4):3469-3478. doi: 10.1007/s11033-023-08310-x. Epub 2023 Feb 11. Mol Biol Rep. 2023. PMID: 36765018
-
RETRACTED: Thapsigargin triggers cardiac contractile dysfunction via NADPH oxidase-mediated mitochondrial dysfunction: Role of Akt dephosphorylation.Free Radic Biol Med. 2011 Dec 15;51(12):2172-2184. doi: 10.1016/j.freeradbiomed.2011.09.005. Epub 2011 Sep 16. Free Radic Biol Med. 2011. Retraction in: Free Radic Biol Med. 2023 Nov 1;208:877. doi: 10.1016/j.freeradbiomed.2023.09.025. PMID: 21996563 Free PMC article. Retracted.
References
-
- Preedy VR, Adachi J, Peters TJ, Worrall S, Parkkila S, Niemela O, Asamo M, Ueno Y, Takeda K, Yamauchi M, Sakamoto K, Takagi M, Nakajima H, Toda G. Recent advances in the pathology of alcoholic myopathy. Alcohol Clin Exp. Res. 2001;25:54S–59S. - PubMed
-
- Spies CD, Sander M, Stangl K, Fernandez-Sola J, Preedy VR, Rubin E, Andreasson S, Hanna EZ, Kox WJ. Effects of alcohol on the heart. Curr. Opin. Crit Care. 2001;7:337–343. - PubMed
-
- Lazarevic AM, Nakatani S, Neskovic AN, Marinkovic J, Yasumura Y, Stojicic D, Miyatake K, Bojic M, Popovic AD. Early changes in left ventricular function in chronic asymptomatic alcoholics: relation to the duration of heavy drinking. J Am Coll Cardiol. 2000;35:1599–1606. - PubMed
-
- Ren J, Wold LE. Mechanisms of alcoholic heart disease. Ther. Adv. Cardiovasc. Dis. 2008;2:497–506. - PubMed
-
- Preedy VR, Patel VB, Why HJ, Corbett JM, Dunn MJ, Richardon PJ. Alcohol and the heart: biochemical alterations. Cardiovasc. Res. 1996;31:139–147. - PubMed
Publication types
MeSH terms
Substances
Grants and funding
LinkOut - more resources
Full Text Sources
Molecular Biology Databases
Research Materials
Miscellaneous
