. 2010 Dec;45(4):378-88.
doi: 10.1016/j.mcn.2010.07.011. Epub 2010 Aug 3.

Ephrin-B3 regulates glutamate receptor signaling at hippocampal synapses

Affiliations

Ephrin-B3 regulates glutamate receptor signaling at hippocampal synapses

Marcia D Antion et al. Mol Cell Neurosci. 2010 Dec.

Abstract

B-ephrin-EphB receptor signaling modulates NMDA receptors by inducing tyrosine phosphorylation of NR2 subunits. Ephrins and EphB RTKs are localized to postsynaptic compartments in the CA1, and therefore potentially interact in a non-canonical cis- configuration. However, it is not known whether cis- configured receptor-ligand signaling is utilized by this class of RTKs, and whether this might influence excitatory synapses. We found that ablation of ephrin-B3 results in an enhancement of the NMDA receptor component of synaptic transmission relative to the AMPA receptor component in CA1 synapses. Synaptic AMPA receptor expression is reduced in ephrin-B3 knockout mice, and there is a marked enhancement of tyrosine phosphorylation of the NR2B receptor subunit. In a reduced system co-expression of ephrin-B3 attenuated EphB2-mediated NR2B tyrosine phosphorylation. Moreover, phosphorylation of EphB2 was elevated in the hippocampus of ephrin-B3 knockout mice, suggesting that regulation of EphB2 activity is lost in these mice. Direct activation of EphB RTKs resulted in phosphorylation of NR2B and a potential signaling partner, the non-receptor tyrosine kinase Pyk2. Our data suggests that ephrin-B3 limits EphB RTK-mediated phosphorylation of the NR2B subunit through an inhibitory cis- interaction which is required for the correct function of glutamatergic CA1 synapses.


Figures

Figure 1
Figure 1. NMDA/AMPA ratio is enhanced in CA1 pyramidal neurons from ephrin-B3neo/neo mice
(Ai) Representative traces of EPSCs recorded at −70 mV and +40 mV from ephrin-B3wt/wt mice. The AMPA component was measured as the peak of the current at −70 mV, and the NMDA component was measured 60–62.5 ms after the onset of the outward current at +40 mV. From this time point onwards, AMPA receptors do not contribute significantly to the response and the remaining current is mediated wholly by NMDA receptors (shaded area) (Marie et al., 2005). Calibration: 50 pA, 100 ms (Aii) Representative traces from ephrin-B3neo/neo mice. Calibration: 25 pA, 100 ms (Aiii) Grouped data from all recordings from ephrin-B3neo/neo mice and heterozygote and wildtype littermates. (Bi) Representative EPSC traces from reverse signaling incompetent ephrin-B3lacZ/lacZ expressing mice. Calibration: 25 pA, 100 ms (Bii) Grouped data from ephrin-B3lacZ/lacZ and interleaved littermate control recordings. Significance (p < 0.05) is denoted by an asterisk.
Figure 2
Figure 2. Amplitude of mEPSCs is reduced in ephrin-B3neo/neo mice
(Ai) Representative mEPSC recordings from ephrin-B3wt/wt and (Aii) ephrin-B3neo/neo mice. Calibration: 10 pA, 250 ms (Bi) Cumulative distribution of mEPSC amplitudes measured in wildtype (red) and hypomorphic mice (blue). (Bii) Mean amplitudes of mEPSCs in ephrin-B3wt/wt (red) and ephrin-B3neo/neo mice (blue). (Ci) Cumulative distribution of mEPSC frequencies in wildtype and knockout animals. (Cii) Graph of mean frequencies of mEPSC events. (Di) Cumulative distribution of Sr2+ mEPSC amplitudes measured in recordings from wildtype (red) and knockout (blue) animals.
Figure 3
Figure 3. Ifenprodil sensitivity of the NMDA EPSC in not altered in ephrin-B3neo/neo
(A) Representative whole-cell voltage-clamp recordings of NMDA EPSC (+40 mV) from a wildtype mouse before and after application of the NR2B selective antagonist ifenprodil (3 µM). (B) Representative NMDA EPSCs recorded from ephrin-B3neo/neo mouse. Calibration: 20 pA, 100 ms. (C) Grouped data from all recordings demonstrating the percentage inhibition of the NMDA EPSC by ifenprodil. (D) The mean NMDA EPSC deactivation time constant (τdecay) in wildtype and littermate ephrin-B3neo/neo mice.
Figure 4
Figure 4. Selective upregulation of tyrosine phosphorylation of the NR2B NMDA receptor subunit in ephrin-B3neo/neo mice
(A) Representative gel run with hippocampal homogenates immunoprecipitated with a pan-tyrosine phosphorylation antibody (4G10, p-Tyr). Phosphorylated proteins were immunoblotted with NR2A and NR2B antibodies. The bands observed in the immunoprecipitation are specific in comparison to negative (IgG - 5 µg) and positive (Input - 40 µg hippocampal homogenate) controls within each experiment. Each blot was probed with anti-mouse IgG to reveal the reduced heavy chain IgG bands. (B) Quantification of tyrosine-phosphorylated NR2 subunits. Immunoreactive bands were quantified by densitometry and normalized to the reduced heavy chain IgG to correct for immunoprecipitation efficiency. For each series of experiments, the relative immunoreactivity densitometric value was normalized to wildtype. (C) Representative blot of hippocampal homogenates immunoprecipitated with NR2B and immunoblotted with site specific phosphotyrosine antibodies (Y1252, Y1336, and Y1472). (D) Quantification of site specific tyrosine phosphorylation of NR2B. The measured densitometric value was normalized to total NR2B to determine the ratio of phosphorylated NR2B. The values are expressed as a percent of control (wildtype) immunoreactivity. Significant values (p < 0.05) are indicated by an asterisk.
Figure 5
Figure 5. Ephrin-B3 attenuates EphB2-mediated NR2B subunit Y1252 phosphorylation
(A) HEK 293 cells were transfected with NMDA receptor (equivalent amounts of NR1a and NR2B cDNA) in the presence and absence of FLAG-tagged EphB2 and ephrin-B3 as indicated. Representative immunoblots of cell lysates confirm the presence of EphB2-FLAG and ephrin-B3 (pan-ephrin antibody). (Aii) Top panel, Cis-: Representative immunoblots from experiments were NMDAR subunits, EphB2 and ephrin-B3 were co-transfected and cell lysates that were immunoprecipitated with NR2B and immunoblotted with tyrosine site specific antibodies to Y1252, Y1336, and Y1472 of the NR2B subunit. Lower panel, Trans-: Representative immunoblots from mixing experiments, where NMDAR subunits and EphB2 were co-transfected, and ephrin-B3 was transfected into separate cells before mixing (see Experimental Methods). (B) Quantification of the percent decrease in EphB2-mediated NR2B Y1252 phosphorylation in the presence of ephrin-B3 from 4 individual experiments. For each experiment the densitometric value of phosphorylated/total NR2B subunit in the presence of ephrin-B3 (4:1 ratio respective to the NMDAR) was compared to ephrin-B3 untransfected cells in the presence of EphB2-FLAG (1.5-fold and 2-fold ratios respective to the NMDAR). Data is presented as percent reduction of the ephrin-B3 untransfected samples for each of the EphB2 cDNA concentrations. Comparisons were made using the Student’s t-test.
Figure 6
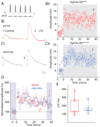
Figure 6. Magnitude of theta-burst pairing-induced LTP is not different in ephrin-B3neo/neo mice
(A) Theta-burst pairing protocol. Brief (2 nA, 2 ms) postsynaptic depolarization - evoked action potentials (top) were coincident with evoked EPSPs (represented below). A train consisted of five burst pairings (50 ms duration, 100 Hz), delivered at theta-frequency (200 ms inter-burst interval, 5 Hz). A total of three trains of theta-burst pairings were delivered at 0.1 Hz to induce LTP. Calibration: 50 mV, 50 ms. (Bi) Representative EPSP recorded in whole-cell current clamp mode from CA1 pyramidal neurons in wildtype mice before (1) and 35 – 40 min after LTP induction (2) (Bii) Time-course of a single LTP experiment from ephrin-B3wt/wt mouse. Shaded area represents time after LTP induction. (Ci) Representative EPSPs recorded from ephrin-B3neo/neo mice before (1) and after LTP induction (2). Calibration: 2 mV, 50 ms (Cii) Time-course of a single LTP experiment from ephrin-B3neo/neo mouse. (D) Grouped data from all LTP recordings in ephrin-B3wt/wt (red) and ephrin-B3neo/neo mice (blue). For clarity data are parsed to show amplitudes from each group at one minute intervals. (E) Grouped data showing the magnitude of LTP calculated as the % potentiation between 35 – 40 min after induction compared to the pre-induction control period (shaded areas in (D)).
Figure 7
Figure 7. Ephrin-B3 ablation leads to activation of EphB RTKs and direct activation of Eph RTKs enhances phosphorylation of Pyk2 and NR2B subunit
(A) Whole hippocampal homogenates from wildtype and ephrin-B3neo/neo mice were examined for the phosphorylation of EphB2 (Ai) Representative gel immunoblotted with a tyrosine phosphorylation site-specific antibody (Y-EphB2) and total EphB2. (Aii) Quantification of Y-EphB2 immunoreactivity. (B) EphB RTKs were activated by treating cortical neurons for 30 min with preclustered ephrin-B1-Fc (EB-Fc) or Fc fragment (Fc) alone and samples were immunoprecipitated with a pan-tyrosine antibody. (Bi) Representative blot of EphB RTK-stimulated cultures immunoprecipitated with pan-tyrosine antibody and immunoblotted with Pyk2 and NR2B (Bii) Quantification of NR2B and Pyk2. For each series of experiments, the relative immunoreactivity densitometric value was compared to the vehicle (Fc fragment) control. The measured densitometric value was normalized to total IgG to determine the ratio of phosphorylated protein. The values are expressed as a percent of control immunoreactivity. Significant values (p < 0.05) are indicated by an asterisk.

References

    1. Armstrong JN, Saganich MJ, Xu NJ, Henkemeyer M, Heinemann SF, Contractor A. B-ephrin reverse signaling is required for NMDA-independent long-term potentiation of mossy fibers in the hippocampus. J Neurosci. 2006;26:3474–3481. - PMC - PubMed
    1. Barth AL, Malenka RC. NMDAR EPSC kinetics do not regulate the critical period for LTP at thalamocortical synapses. Nat Neurosci. 2001;4:235–236. - PubMed
    1. Bellone C, Nicoll RA. Rapid bidirectional switching of synaptic NMDA receptors. Neuron. 2007;55:779–785. - PubMed
    1. Carvalho RF, Beutler M, Marler KJ, Knoll B, Becker-Barroso E, Heintzmann R, Ng T, Drescher U. Silencing of EphA3 through a cis interaction with ephrinA5. Nat Neurosci. 2006;9:322–330. - PubMed
    1. Cathala L, Misra C, Cull-Candy S. Developmental profile of the changing properties of NMDA receptors at cerebellar mossy fiber-granule cell synapses. J Neurosci. 2000;20:5899–5905. - PMC - PubMed

Publication types