Review
. 2010 Dec;22(6):801-8.
doi: 10.1016/j.ceb.2010.07.001. Epub 2010 Aug 2.

Regulated protein kinases and phosphatases in cell cycle decisions

Affiliations
Review

Regulated protein kinases and phosphatases in cell cycle decisions

Bela Novak et al. Curr Opin Cell Biol. 2010 Dec.

Abstract

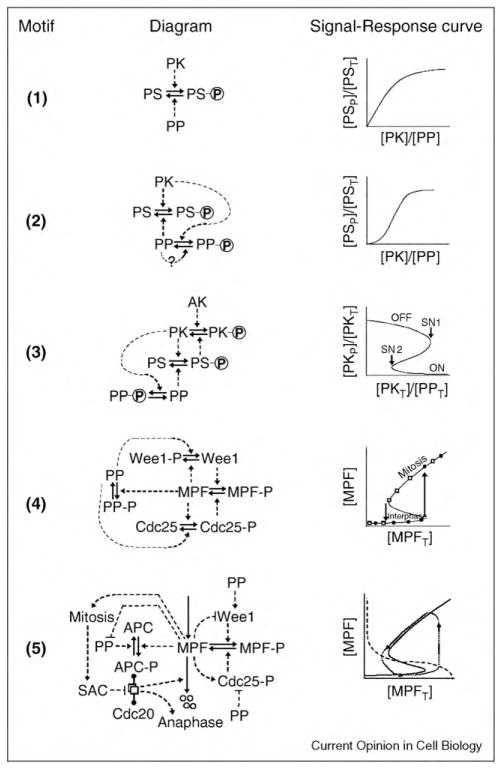
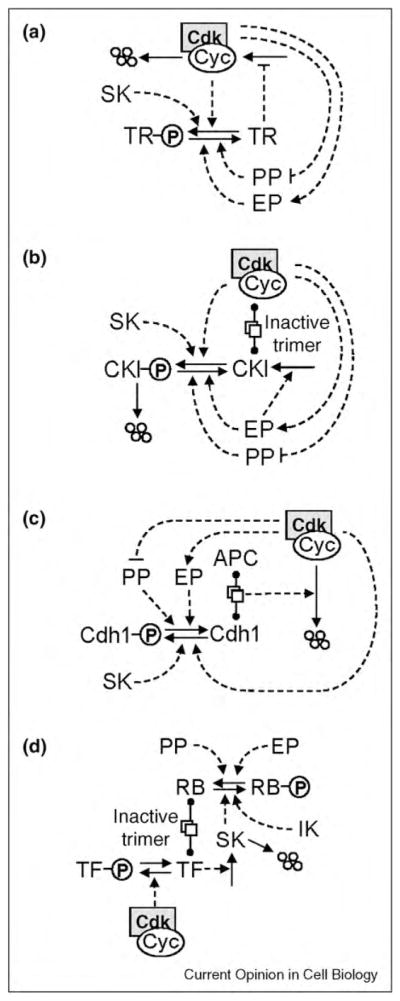
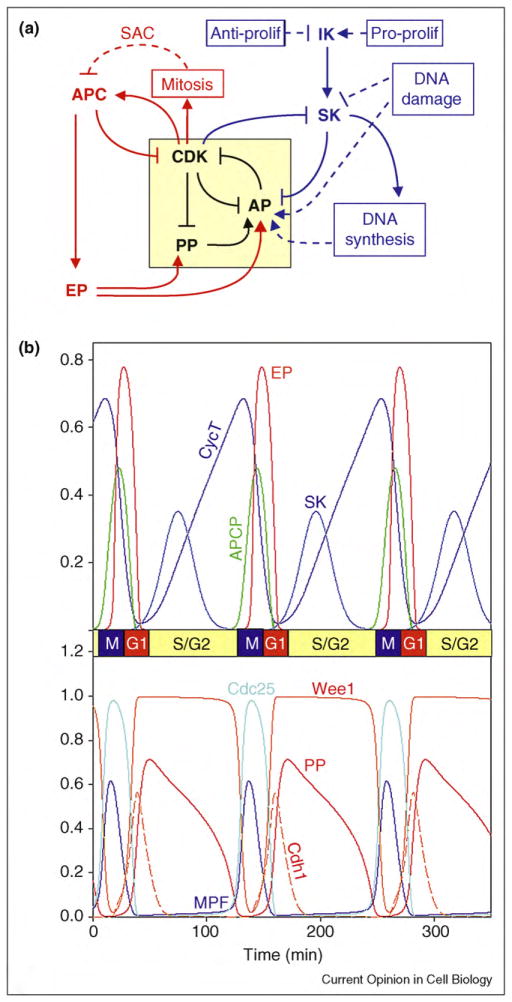
Many aspects of cell physiology are controlled by protein kinases and phosphatases, which together determine the phosphorylation state of targeted substrates. Some of these target proteins are themselves kinases or phosphatases or other components of a regulatory network characterized by feedback and feed-forward loops. In this review we describe some common regulatory motifs involving kinases, phosphatases, and their substrates, focusing particularly on bistable switches involved in cellular decision processes. These general principles are applied to cell cycle transitions, with special emphasis on the roles of regulated phosphatases in orchestrating progression from one phase to the next of the DNA replication-division cycle.


Figures

Figure 1
Figure 1
Regulatory motifs. In each motif, a solid arrow indicates a chemical reaction, and a dashed arrow indicates an enzyme that catalyzes the reaction. (1) The basic motif. A protein substrate (PS) is phosphorylated by a protein kinase (PK) and dephosphorylated by a protein phosphatase (PP). The incoming ‘signal’ is the ratio of PK activity to PP activity; and the response is the fraction of PS in the phosphorylated form. The response saturates at f = 1 for large values of the PK:PP ratio. [PST] = [PS] + [PSP] = total concentration of the substrate. (2) Coherent feed-forward loop. PK phosphorylates and inactivates PP. The active form of PP may promote its own accumulation by auto-dephosphorylation (the dotted feedback signal marked with a ‘?’). The signal–response curve is now sigmoidal. (3) Positive feedback loop. The protein substrate of motif #2 is now a phosphatase that activates PK by reversing an inhibitory phosphorylation carried out by the ‘antagonistic kinase’ (AK). In this case, the response variable, the fraction of PK in the phosphorylated form, corresponds to the low-activity state of PK. The signal–response curve shows a region of bistability between the points marked SN1 and SN2. (4) Bistability in the activation of MPF. MPF (mitosis promoting factor) is a heterodimer of cyclin B and Cdk1. Wee1 phosphorylates MPF on an inhibitory residue of the Cdk1 subunit. Cdc25 removes the inhibitory phosphate group. PP2A is the phosphatase that opposes the phosphorylation of Wee1 and Cdc25 by MPF. In the signal–response curve, [MPFT] = [MPF] + [MPFP] = total MPF = total concentration of cyclin B, because the Cdk1 subunit is present in excess and free Cdk1 molecules have no kinase activity. The signal–response curve shows a robust region of bistability for intermediate levels of total cyclin B. (5) Negative feedback and oscillations. The positive feedback loops of motif #4 are supplemented by a negative feedback loop, whereby MPF activates the APC/Cdc20 complex, which initiates the proteolysis of cyclin B. The dashed lines from MPF to Wee1, Cdc25, and so on, indicate that MPF has an effect (activation or inhibition) on the target protein, without specifying the precise molecular mechanism of this effect. This is a shorthand convention to simplify the diagram, and the mechanism of the effect can be deduced from previously described motifs. The ‘dumbbell’ notation indicates the reversible formation of a complex between proteins A and B at the ends of the dumbbell, and an icon for the complex (overlapping white rectangles) is placed on the middle of the dumbbell. Four small circles indicate degradation products of a protein. On the signal–response plane, there is no stable steady state, and the system executes periodic oscillations around the trajectory indicated by the dotted line.
Figure 2
Figure 2
G1-stabilizing motifs. In each case, CDK is involved in a double-negative feedback loop with a protein that stabilizes the G1 state of the cell cycle. (a) A transcriptional repressor (TR) mediates against expression of the cyclin gene. (b) The CDK inhibitor (CKI) binds to and inactivates cyclin/ CDK dimers. (c) Cdh1, an APC partner, assists in the proteolysis of cyclin proteins. In each case, the exit phosphatase (EP) activates the G1 stabilizers, and the starter kinase (SK) promotes inactivation of the G1 stabilizers. (d) Expression of the starter kinase gene is regulated by a transcriptional inhibitor, RB (retinoblastoma-like protein). Initial production of SK requires phosphorylation of RB by an initiator kinase (IK), but thereafter SK can keep RB phosphorylated and inactive. Later in the cell cycle, the transcription factor for SK is inactivated by phosphorylation by cyclin B-dependent kinase.
Figure 3
Figure 3
General framework for cell cycle regulation by protein kinases and phosphatases. (a) Wiring diagram. The yellow box highlights the central toggle switch created by the ‘battle’ between CDK (cyclin B-dependent kinase) on one side and PP (protein phosphatase) and AP (antagonistic proteins) on the other side. In G1 phase, PP and AP are winning the battle, and CDK activity is low. The G1—S transition is promoted by an initiator kinase (IK) that upregulates a starter kinase SK. SK initiates DNA synthesis and downregulates AP. Rising activity of CDK drives the cell into mitosis and promotes mitotic-exit functions of the APC: degradation of cohesins, of cyclin B, and of an inhibitor of the exit phosphatase (EP). EP promotes return to G1 phase by activating PP and AP. Checkpoint signals are indicated by dashed lines. DNA synthesis delays progression into mitosis by activating an AP (Wee1). The spindle assembly checkpoint (SAC) delays exit from mitosis by inhibiting a component of APC (namely, Cdc20). Pro-proliferative and anti-proliferative signals determine whether a cell will start a new round of DNA replication and cell division by regulating the level of IK. DNA damage prevents DNA replication by inhibiting SK, and it prevents entry into mitosis by activating AP (Wee1 and CKI). (b) Numerical simulation. We convert scheme A into a set of nonlinear ordinary differential equations and compute an oscillatory solution for a reasonable choice of kinetic parameter values (for details, see Supplementary Material S4).

References

    1. Bray D. Protein molecules as computational elements in living cells. Nature. 1995;376:307–312. - PubMed
    1. Tyson JJ, Chen K, Novak B. Network dynamics and cell physiology. Nat Rev Mol Cell Biol. 2001;2:908–916. - PubMed
    1. Bollen M, Gerlich DW, Lesage B. Mitotic phosphatases: from entry guards to exit guides. Trends Cell Biol. 2009;19:531–541. - PubMed
    1. De Wulf P, Montani F, Visintin R. Protein phosphatases take the mitotic stage. Curr Opin Cell Biol. 2009;21:806–815. - PubMed
    1. Queralt E, Uhlmann F. Cdk-counteracting phosphatases unlock mitotic exit. Curr Opin Cell Biol. 2008;20:661–668. - PMC - PubMed

MeSH terms

Substances