

Characterizing the native codon usages of a genome: an axis projection approach
- PMID: 20679093
- PMCID: PMC3002238
- DOI: 10.1093/molbev/msq185
Characterizing the native codon usages of a genome: an axis projection approach
Abstract
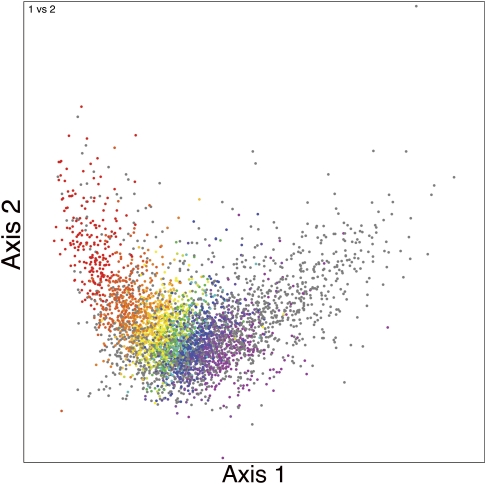
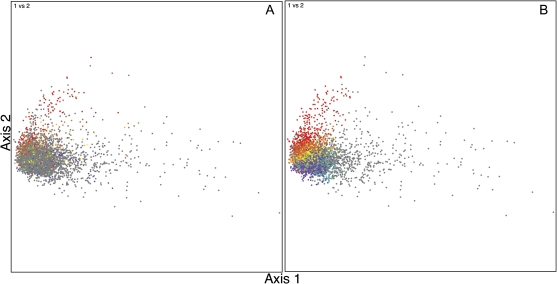
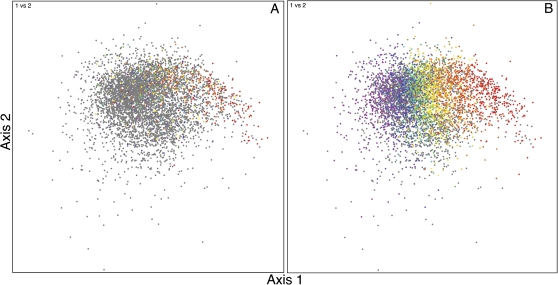
Codon usage can provide insights into the nature of the genes in a genome. Genes that are "native" to a genome (have not been recently acquired by horizontal transfer) range in codon usage from a low-bias "typical" usage to a more biased "high-expression" usage characteristic of genes encoding abundant proteins. Genes that differ from these native codon usages are candidates for foreign genes that have been recently acquired by horizontal gene transfer. In this study, we present a method for characterizing the codon usages of native genes--both typical and highly expressed--within a genome. Each gene is evaluated relative to a half line (or axis) in a 59D space of codon usage. The axis begins at the modal codon usage, the usage that matches the largest number of genes in the genome, and it passes through a point representing the codon usage of a set of genes with expression-related bias. A gene whose codon usage matches (does not significantly differ from) a point on this axis is a candidate native gene, and the location of its projection onto the axis provides a general estimate of its expression level. A gene that differs significantly from all points on the axis is a candidate foreign gene. This automated approach offers significant improvements over existing methods. We illustrate this by analyzing the genomes of Pseudomonas aeruginosa PAO1 and Bacillus anthracis A0248, which can be difficult to analyze with commonly used methods due to their biased base compositions. Finally, we use this approach to measure the proportion of candidate foreign genes in 923 bacterial and archaeal genomes. The organisms with the most homogeneous genomes (containing the fewest candidate foreign genes) are mostly endosymbionts and parasites, though with exceptions that include Pelagibacter ubique and Beutenbergia cavernae. The organisms with the most heterogeneous genomes (containing the most candidate foreign genes) include members of the genera Bacteroides, Corynebacterium, Desulfotalea, Neisseria, Xylella, and Thermobaculum.
Figures
Similar articles
-
Analysis of codon usage patterns of bacterial genomes using the self-organizing map.Mol Biol Evol. 2001 May;18(5):792-800. doi: 10.1093/oxfordjournals.molbev.a003861. Mol Biol Evol. 2001. PMID: 11319263
-
Codon Usage Heterogeneity in the Multipartite Prokaryote Genome: Selection-Based Coding Bias Associated with Gene Location, Expression Level, and Ancestry.mBio. 2019 May 28;10(3):e00505-19. doi: 10.1128/mBio.00505-19. mBio. 2019. PMID: 31138741 Free PMC article.
-
Molecular characterization of virulent genes in Pseudomonas aeruginosa based on componential usage divergence.Sci Rep. 2025 Apr 2;15(1):11246. doi: 10.1038/s41598-025-95579-6. Sci Rep. 2025. PMID: 40175567 Free PMC article.
-
Synonymous codon usage in Pseudomonas aeruginosa PA01.Gene. 2002 May 1;289(1-2):131-9. doi: 10.1016/s0378-1119(02)00503-6. Gene. 2002. PMID: 12036591
-
Evolutionary responses to codon usage of horizontally transferred genes in Pseudomonas aeruginosa: gene retention, amelioration and compensatory evolution.Microb Genom. 2021 Jun;7(6):000587. doi: 10.1099/mgen.0.000587. Microb Genom. 2021. PMID: 34165421 Free PMC article.
Cited by
-
Draft genome sequence of Bacteroides vulgatus PC510, a strain isolated from human feces.J Bacteriol. 2011 Aug;193(15):4025-6. doi: 10.1128/JB.05256-11. Epub 2011 May 27. J Bacteriol. 2011. PMID: 21622758 Free PMC article.
-
scnRCA: a novel method to detect consistent patterns of translational selection in mutationally-biased genomes.PLoS One. 2013 Oct 7;8(10):e76177. doi: 10.1371/journal.pone.0076177. eCollection 2013. PLoS One. 2013. PMID: 24116094 Free PMC article.
-
Codon Deviation Coefficient: a novel measure for estimating codon usage bias and its statistical significance.BMC Bioinformatics. 2012 Mar 22;13:43. doi: 10.1186/1471-2105-13-43. BMC Bioinformatics. 2012. PMID: 22435713 Free PMC article.
-
Codon Usage Optimization in the Prokaryotic Tree of Life: How Synonymous Codons Are Differentially Selected in Sequence Domains with Different Expression Levels and Degrees of Conservation.mBio. 2020 Jul 21;11(4):e00766-20. doi: 10.1128/mBio.00766-20. mBio. 2020. PMID: 32694138 Free PMC article.
-
Similarity of genes horizontally acquired by Escherichia coli and Salmonella enterica is evidence of a supraspecies pangenome.Proc Natl Acad Sci U S A. 2011 Dec 13;108(50):20154-9. doi: 10.1073/pnas.1109451108. Epub 2011 Nov 29. Proc Natl Acad Sci U S A. 2011. PMID: 22128332 Free PMC article.
References
-
- Andersson SG, Sharp PM. Codon usage and base composition in Rickettsia prowazekii. J Mol Evol. 1996;42:525–536. - PubMed
-
- Badger JH. Exploration of microbial genomic sequences via comparative analysis [PhD dissertation] 1999 [Urbana (IL)]: University of Illinois at Urbana-Champaign. p. 45–92.
-
- Banerjee T, Ghosh TC. Gene expression level shapes the amino acid usages in Prochlorococcus marinus MED4. J Biomol Struct Dyn. 2006;23:547–553. - PubMed
-
- Bennetzen JL, Hall BD. Codon selection in yeast. J Biol Chem. 1982;257:3026–3031. - PubMed
Publication types
MeSH terms
Substances
LinkOut - more resources
Full Text Sources
Other Literature Sources
Molecular Biology Databases
