Human heme oxygenase-1 efficiently catabolizes heme in the absence of biliverdin reductase
- PMID: 20679134
- PMCID: PMC2967390
- DOI: 10.1124/dmd.110.034777
Human heme oxygenase-1 efficiently catabolizes heme in the absence of biliverdin reductase
Abstract
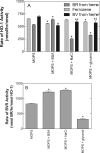
Heme oxygenase 1 (HO-1) uses molecular oxygen and electrons from NADPH cytochrome P450 reductase to convert heme to CO, ferrous iron, and biliverdin (BV). Enzymatic studies with the purified 30-kDa form of HO-1 routinely use a coupled assay containing biliverdin reductase (BVR), which converts BV to bilirubin (BR). BVR is believed to be required for optimal HO-1 activity. The goal of this study was to determine whether HO-1 activity could be monitored directly by following BV generation or iron release (using the ferrous iron chelator, ferrozine) in the absence of BVR. Using assays for each of the three end products, we found that HO-1 activity was stimulated in the presence of catalase and comparable rates were measured with each assay. Absorbance scans revealed characteristic spectra for BR, BV, and/or the ferrozine-iron complex. The optimal conditions were slightly different for the direct and coupled assays. BSA activated the coupled but inhibited the direct assays, and the assays had different pH optima. By measuring the activity of BVR directly using BV as a substrate, these differences were attributed to different enzymatic properties of BVR and HO-1. Thus, BVR is not needed to measure the activity of HO-1 when catalase is present. In fact, the factors affecting catalysis by HO-1 are better understood using the direct assays because the coupled assay can be influenced by properties of BVR.
Figures


Similar articles
-
Protein/protein interactions in the mammalian heme degradation pathway: heme oxygenase-2, cytochrome P450 reductase, and biliverdin reductase.J Biol Chem. 2014 Oct 24;289(43):29836-58. doi: 10.1074/jbc.M114.582783. Epub 2014 Sep 7. J Biol Chem. 2014. PMID: 25196843 Free PMC article.
-
Conversion of biliverdin to bilirubin by biliverdin reductase contributes to endothelial cell protection by heme oxygenase-1-evidence for direct and indirect antioxidant actions of bilirubin.J Mol Cell Cardiol. 2010 Aug;49(2):186-95. doi: 10.1016/j.yjmcc.2010.04.011. Epub 2010 Apr 27. J Mol Cell Cardiol. 2010. PMID: 20430037
-
Small interference RNA-mediated gene silencing of human biliverdin reductase, but not that of heme oxygenase-1, attenuates arsenite-mediated induction of the oxygenase and increases apoptosis in 293A kidney cells.J Biol Chem. 2005 Apr 29;280(17):17084-92. doi: 10.1074/jbc.M413121200. Epub 2005 Feb 28. J Biol Chem. 2005. PMID: 15741166
-
Recent Advances in the Understanding of the Reaction Chemistries of the Heme Catabolizing Enzymes HO and BVR Based on High Resolution Protein Structures.Curr Med Chem. 2020;27(21):3499-3518. doi: 10.2174/0929867326666181217142715. Curr Med Chem. 2020. PMID: 30556496 Free PMC article. Review.
-
The Janus face of the heme oxygenase/biliverdin reductase system in Alzheimer disease: it's time for reconciliation.Neurobiol Dis. 2014 Feb;62:144-59. doi: 10.1016/j.nbd.2013.09.018. Epub 2013 Oct 2. Neurobiol Dis. 2014. PMID: 24095978 Free PMC article. Review.
Cited by
-
Identification and Characterization of the miRNA Transcriptome Controlling Green Pigmentation of Chicken Eggshells.Genes (Basel). 2024 Jun 19;15(6):811. doi: 10.3390/genes15060811. Genes (Basel). 2024. PMID: 38927746 Free PMC article.
-
Like iron in the blood of the people: the requirement for heme trafficking in iron metabolism.Front Pharmacol. 2014 Jun 4;5:126. doi: 10.3389/fphar.2014.00126. eCollection 2014. Front Pharmacol. 2014. PMID: 24926267 Free PMC article. Review.
-
Curcumin ameliorates the permeability of the blood-brain barrier during hypoxia by upregulating heme oxygenase-1 expression in brain microvascular endothelial cells.J Mol Neurosci. 2013 Oct;51(2):344-51. doi: 10.1007/s12031-013-9989-4. Epub 2013 Mar 15. J Mol Neurosci. 2013. PMID: 23494637
-
Beneficial effects of diminished production of hydrogen sulfide or carbon monoxide on hypertension and renal injury induced by NO withdrawal.Br J Pharmacol. 2015 Mar;172(6):1607-19. doi: 10.1111/bph.12674. Epub 2014 Jul 2. Br J Pharmacol. 2015. PMID: 24597655 Free PMC article.
-
Macrophages and iron trafficking at the birth and death of red cells.Blood. 2015 May 7;125(19):2893-7. doi: 10.1182/blood-2014-12-567776. Epub 2015 Mar 16. Blood. 2015. PMID: 25778532 Free PMC article. Review.
References
-
- Bauer M, Bauer I. (2002) Heme oxygenase-1: redox regulation and role in the hepatic response to oxidative stress. Antioxid Redox Signal 4:749–758 - PubMed
-
- Bissell DM, Hammaker LE. (1976) Cytochrome P-450 heme and the regulation of hepatic heme oxygenase activity. Arch Biochem Biophys 176:91–102 - PubMed
Publication types
MeSH terms
Substances
Grants and funding
LinkOut - more resources
Full Text Sources

