

Seasonal and interannual variability of climate and vegetation indices across the Amazon
- PMID: 20679201
- PMCID: PMC2930478
- DOI: 10.1073/pnas.0908741107
Seasonal and interannual variability of climate and vegetation indices across the Amazon
Abstract
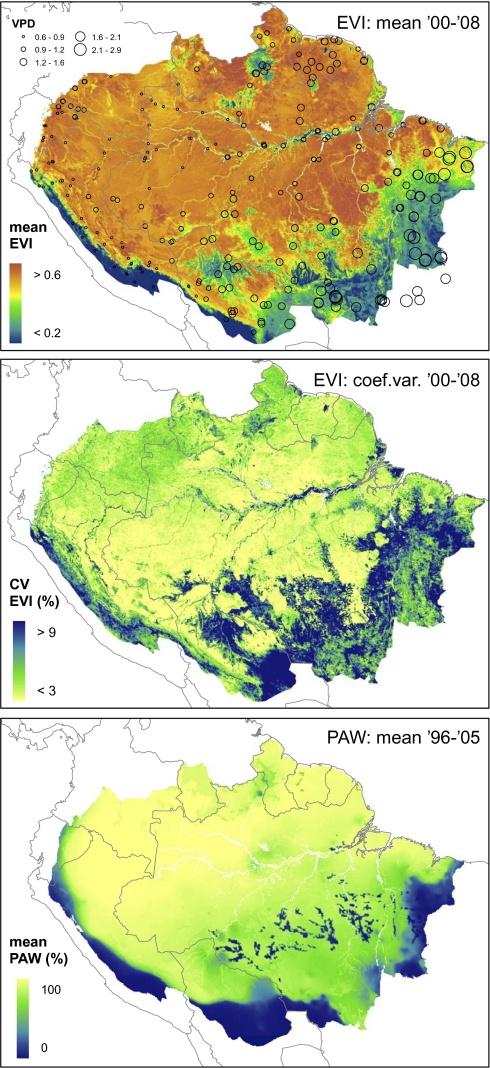
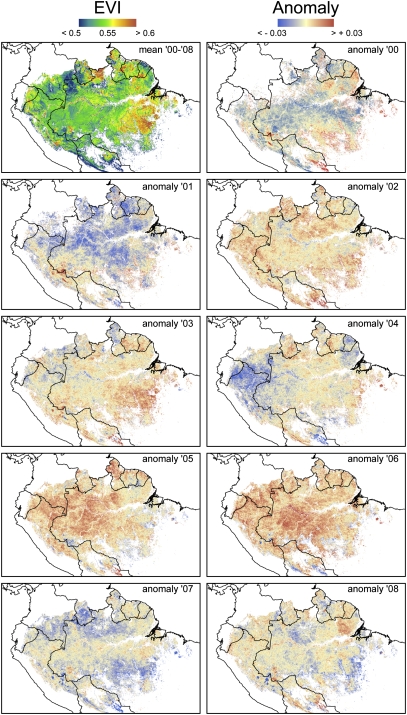
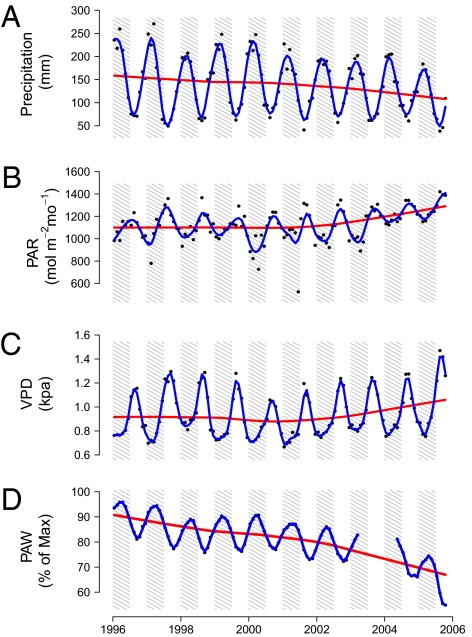
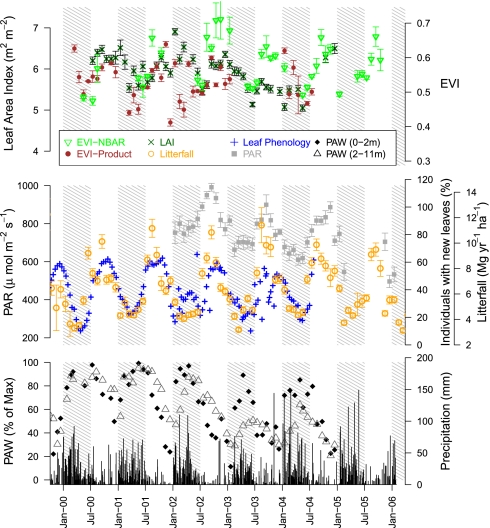
Drought exerts a strong influence on tropical forest metabolism, carbon stocks, and ultimately the flux of carbon to the atmosphere. Satellite-based studies have suggested that Amazon forests green up during droughts because of increased sunlight, whereas field studies have reported increased tree mortality during severe droughts. In an effort to reconcile these apparently conflicting findings, we conducted an analysis of climate data, field measurements, and improved satellite-based measures of forest photosynthetic activity. Wet-season precipitation and plant-available water (PAW) decreased over the Amazon Basin from 1996-2005, and photosynthetically active radiation (PAR) and air dryness (expressed as vapor pressure deficit, VPD) increased from 2002-2005. Using improved enhanced vegetation index (EVI) measurements (2000-2008), we show that gross primary productivity (expressed as EVI) declined with VPD and PAW in regions of sparse canopy cover across a wide range of environments for each year of the study. In densely forested areas, no climatic variable adequately explained the Basin-wide interannual variability of EVI. Based on a site-specific study, we show that monthly EVI was relatively insensitive to leaf area index (LAI) but correlated positively with leaf flushing and PAR measured in the field. These findings suggest that production of new leaves, even when unaccompanied by associated changes in LAI, could play an important role in Basin-wide interannual EVI variability. Because EVI variability was greatest in regions of lower PAW, we hypothesize that drought could increase EVI by synchronizing leaf flushing via its effects on leaf bud development.
Conflict of interest statement
The authors declare no conflict of interest.
Figures
References
-
- Malhi Y, et al. Climate change, deforestation, and the fate of the Amazon. Science. 2008;319:169–172. - PubMed
-
- Costa MH, Foley JA. Combined effects of deforestation and doubled atmospheric CO2 concentrations on the climate of Amazonia. J Clim. 2000;13:18–34.
-
- Werth D, Avissar R. The local and global effects of Amazon deforestation. J Geophys Res. 2002;107:8087–8095.
-
- Nobre CA, Sellers PJ, Shukla J. Amazonian deforestation and regional climate change. J Clim. 1991;4:957–988.
-
- Nepstad D, et al. Amazon drought and its implications for forest flammability and tree growth: A basin-wide analysis. Glob Change Biol. 2004;10:704–717.
Publication types
MeSH terms
Substances
LinkOut - more resources
Full Text Sources
