. 2010 Aug 17;107(33):14751-6.
doi: 10.1073/pnas.1003852107. Epub 2010 Aug 2.

Th17 plasticity in human autoimmune arthritis is driven by the inflammatory environment

Affiliations

Th17 plasticity in human autoimmune arthritis is driven by the inflammatory environment

Kiran Nistala et al. Proc Natl Acad Sci U S A. .

Abstract

In several murine models of autoimmune arthritis, Th17 cells are the dominant initiators of inflammation. In human arthritis the majority of IL-17-secreting cells within the joint express a cytokine phenotype intermediate between Th17 and Th1. Here we show that Th17/1 cells from the joints of children with inflammatory arthritis express high levels of both Th17 and Th1 lineage-specific transcription factors, RORC2 and T-bet. Modeling the generation of Th17/1 in vitro, we show that Th17 cells "convert" to Th17/1 under conditions that mimic the disease site, namely low TGFbeta and high IL-12 levels, whereas Th1 cells cannot convert to Th17. Th17/1 cells from the inflamed joint share T-cell receptor (TCR) clonality with Th17 cells, suggesting a shared clonal origin between Th17 and Th17/1 cells in arthritis. Using CD161, a lectin-like receptor that is a marker of human Th17, we show synovial Th17 and Th17/1 cells, and unexpectedly, a large proportion of Th1 cells express CD161. We provide evidence to support a Th17 origin for Th1 cells expressing CD161. In vitro, Th17 cells that convert to a Th1 phenotype maintain CD161 expression. In the joint CD161+ Th1 cells share features with Th17 cells, with shared TCR clonality, expression of RORC2 and CCR6 and response to IL-23, although they are IL-17 negative. We propose that the Th17 phenotype may be unstable and that Th17 cells may convert to Th17/1 and Th1 cells in human arthritis. Therefore therapies targeting the induction of Th17 cells could also attenuate Th17/1 and Th1 effector populations within the inflamed joint.


Conflict of interest statement

The authors declare no conflict of interest.

Figures
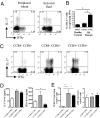
Fig. 1.
Fig. 1.
IL-17+ CD4+ T cells from the synovial fluid of juvenile idiopathic arthritis (JIA) patients coexpress IFN-γ. (A) Representative dot plots from paired PBMC and SFMC from a JIA patient showing flow cytometric analysis of IL-17 and IFN-γ production after stimulation with PMA and ionomycin in the presence of Brefeldin A. Numbers in plots indicate percentages of cytokine-producing cells gated on lymphocytes and CD4+ T cells. (B) Coexpression of IFN-γ in IL-17+ CD4+ T cells taken from healthy control PBMC (n = 9), JIA PBMC (n = 17), and SFMC (n = 21). *P < 0.001. Bars represent mean values (±SEM). (C) Synovial CD4+ T cells were sorted according to expression of CCR4 and CCR6. Shown is IL-17 and IFN-γ production in CCR4−CCR6−, CCR4−CCR6+, and CCR4+CCR6+ sorted populations, one representative experiment of four. (D) IL-17 and IFN-γ protein detected in supernatants from sorted populations as in C, after stimulation with PMA and ionomycin for 5 h (n = 4). *P < 0.05. (E) mRNA expression of RORC2 and AHR in sorted populations as in C, normalized to β2M levels, n = 6 and 4, respectively. *P < 0.05, **P < 0.005. Bars represent mean values (± SEM).
Fig. 2.
Fig. 2.
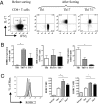
Synovial T cells secreting IL-17 and IFN-γ express both Th1 and Th17 transcription factors. (A) IFN-γ– and IL-17–secreting CD4+ SFMC were detected by flow cytometry using cytokine capture assay. Shown are representative dot plots of unsorted SFMC (Left) gated on CD4+ T cells demonstrating surface capture of IL-17 and IFNγ and sorted by flow cytometry into Th1, Th17, and Th17/1 populations (Right three plots). Numbers in plots indicate percentages of cells secreting cytokines. (B) RORC2, IRF4, and T-bet mRNA expression in synovial CD4+ T-cell populations sorted as above. *P < 0.05. Bars represent mean values (±SEM, n = 3, 4, and 4, respectively). (C) Histogram of RORC2 protein expression analyzed by flow cytometry in healthy control CD4+ T cells (Left); isotype control (gray histogram), Th1 cells (dotted line), and Th17 cells (thick solid line), representative of n = 3 are shown. Summary is shown of RORC2 protein expression (MFI) in cytokine-expressing subpopulations from JIA PBMC (Center) and JIA SFMC CD4+ T cells (Right). *P < 0.05. Bars represent mean values (±SEM, n = 5).
Fig. 3.
Fig. 3.
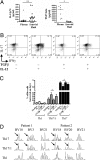
Th17 cells share clonal ancestry with Th17/1 cells and Th1 cells within the joint and demonstrate plasticity in vitro. (A) IL-12 and TGF-β in JIA plasma and synovial fluid (IL-12, n = 16 and 19; and TGFβ, n = 7 and 11, respectively). *P < 0.01, **P < 0.05. (B) Th17 cells were captured from healthy control PBMC and cultured in serum-free medium in the presence of IL-2 or additionally with recombinant IL-12, TGF-β or both as shown. Dot plots of cytokine production in Th17 cells after culture for 6 d are shown. Numbers in plots indicate percentages of cells secreting cytokines. (C) Summary of three independent experiments culturing purified Th17 cells as in B. Bars represent mean number (±SEM) of cells as a percentage of live cells harvested with resultant Th1 cells (open bars), Th17/1 cells (shaded bars), or Th17 cells (solid bars). *P < 0.05. (D) Th17, Th17/1, and Th1 cells were sorted from SFMC using cytokine capture assay and T-cell receptor BV (TRBV) spectratyping was performed (n = 3). Three representative TRBV families are shown, from two separate SFMC samples. Arrows indicate clonal peaks shared between Th17 and Th17/1 populations.
Fig. 4.
Fig. 4.
CD161 expression may identify Th1 cells with a Th17 ancestry. (A) Representative flow cytometric analysis of SFMC comparing CD161 expression with IL-17 and IFN-γ production, gated on CD4+ T cells. Numbers in plots indicate percentage of parent population. (B) CD161 expression in gated synovial Th17 cells, Th17/1 cells, and Th1 cells (n = 4). (C) IL-17+ cells expressing CD161 from healthy controls were sorted and cultured in the presence of IL-12. (Upper Left) Dot plot of intracellular IL-17 and IFN-γ detected on day 6 of culture and CD161 expression in the same cells (indicated by arrows) gated on Th17, Th1, and Th17/1 subpopulations (n = 3). The dotted line represents isotype control and numbers in histograms indicated percentage of cells expressing CD161. (D) Summary of three independent experiments, showing CD161 expression on gated subpopulations as in C and (last column) percentage of control CD161− population expressing CD161 after culture in the same conditions as C. Control data for CD161+ Th17 cells stimulated without IL-12 were equivalent to results seen in Fig. 3B. (E) Cytokine-expressing synovial CD4+ T cells were sorted into IL-17+, CD161+IFN-γ+, and CD161-IFN-γ+ populations. RORC2 and IL-17 mRNA expression in sorted synovial populations is shown. *P < 0.05. Bars represent mean values (±SEM, n = 3). (F) Mean percentage (±SEM, n = 6) of above populations expressing CCR6 protein detected by flow cytometry. (G) (Left) Mean (±SEM, n = 4) IL-23R mRNA expression in sorted populations as in E: Representative flow cytometric analysis of SFMC IL-23R expression (or isotype) and IL-17 production, with plots gated on CD4+ T cells. (Right) Mean percentage (±SEM, n = 6) of IL-17+, CD161+IFN-γ+, and CD161-IFN-γ+ populations expressing IL-23R protein, detected by flow cytometry. (H) Three hundred eighty-three PCR products for TRBV18 from patient 1 were cloned and sequenced. Sequence results are illustrated as pie charts with colored segments to indicate clones that overlap between populations (limited to IL-17+ and CD161+ Th1 populations). Numbers indicate clone size as a percentage of total number sequenced for that cell population. Nonoverlapping clones (gray) and unique sequences (white) for all three populations are shown. Full TCR sequences across the CDR3 junction are listed in Table S1.

Similar articles

Cited by

References

    1. Korn T, Bettelli E, Oukka M, Kuchroo VK. IL-17 and Th17 Cells. Annu Rev Immunol. 2009;27:485–517. - PubMed
    1. Murphy CA, et al. Divergent pro- and antiinflammatory roles for IL-23 and IL-12 in joint autoimmune inflammation. J Exp Med. 2003;198:1951–1957. - PMC - PubMed
    1. Oppmann B, et al. Novel p19 protein engages IL-12p40 to form a cytokine, IL-23, with biological activities similar as well as distinct from IL-12. Immunity. 2000;13:715–725. - PubMed
    1. Manel N, Unutmaz D, Littman DR. The differentiation of human T(H)-17 cells requires transforming growth factor-beta and induction of the nuclear receptor RORgammat. Nat Immunol. 2008;9:641–649. - PMC - PubMed
    1. Nakae S, et al. IL-17 production from activated T cells is required for the spontaneous development of destructive arthritis in mice deficient in IL-1 receptor antagonist. Proc Natl Acad Sci USA. 2003;100:5986–5990. - PMC - PubMed

Publication types

MeSH terms