

Roles of familiarity and novelty in visual preference judgments are segregated across object categories
- PMID: 20679235
- PMCID: PMC2930416
- DOI: 10.1073/pnas.1004374107
Roles of familiarity and novelty in visual preference judgments are segregated across object categories
Abstract
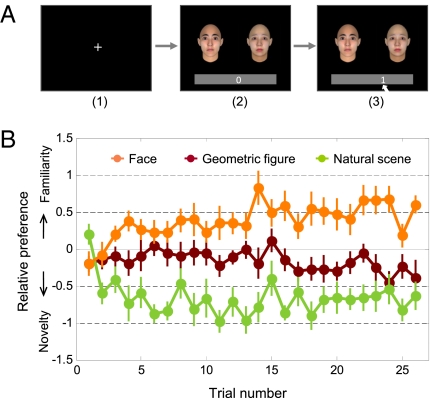
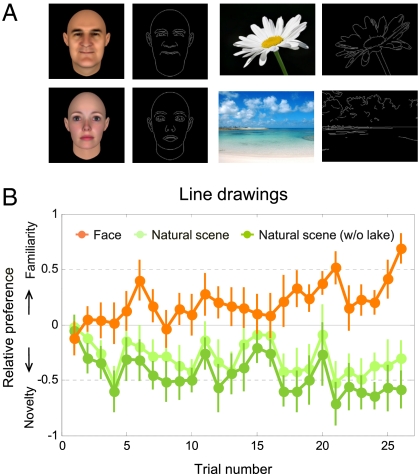
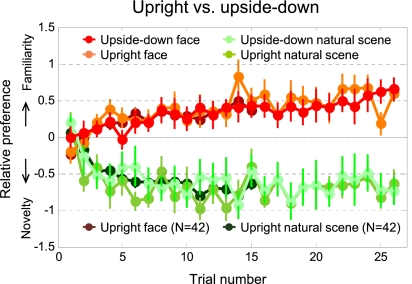
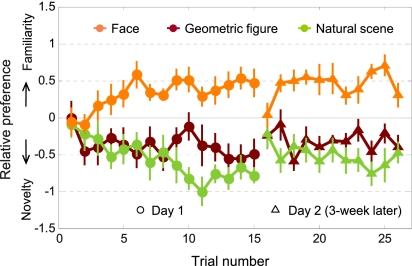
Understanding preference decision making is a challenging problem because the underlying process is often implicit and dependent on context, including past experience. There is evidence for both familiarity and novelty as critical factors for preference in adults and infants. To resolve this puzzling contradiction, we examined the cumulative effects of visual exposure in different object categories, including faces, natural scenes, and geometric figures, in a two-alternative preference task. The results show a clear segregation of preference across object categories, with familiarity preference dominant in faces and novelty preference dominant in natural scenes. No strong bias was observed in geometric figures. The effects were replicated even when images were converted to line drawings, inverted, or presented only briefly, and also when spatial frequency and contour distribution were controlled. The effects of exposure were reset by a blank of 1 wk or 3 wk. Thus, the category-specific segregation of familiarity and novelty preferences is based on quick visual categorization and cannot be caused by the difference in low-level visual features between object categories. Instead, it could be due either to different biological significances/attractiveness criteria across these categories, or to some other factors, such as differences in within-category variance and adaptive tuning of the perceptual system.
Conflict of interest statement
The authors declare no conflict of interest.
Figures
Similar articles
-
Novelty vs. Familiarity Principles in Preference Decisions: Task-Context of Past Experience Matters.Front Psychol. 2011 Mar 18;2:43. doi: 10.3389/fpsyg.2011.00043. eCollection 2011. Front Psychol. 2011. PMID: 21713246 Free PMC article.
-
Characterization of performance on an automated visual recognition memory task in 7.5-month-old infants.Neurotoxicol Teratol. 2020 Sep-Oct;81:106904. doi: 10.1016/j.ntt.2020.106904. Epub 2020 May 30. Neurotoxicol Teratol. 2020. PMID: 32485220 Free PMC article.
-
Of gnomes and leprechauns: the recruitment of recent and categorical contexts in social judgment.Acta Psychol (Amst). 2007 Jul;125(3):361-89. doi: 10.1016/j.actpsy.2006.10.004. Epub 2007 Jan 2. Acta Psychol (Amst). 2007. PMID: 17196919
-
Infants prefer the faces of strangers or mothers to morphed faces: an uncanny valley between social novelty and familiarity.Biol Lett. 2012 Oct 23;8(5):725-8. doi: 10.1098/rsbl.2012.0346. Epub 2012 Jun 13. Biol Lett. 2012. PMID: 22696289 Free PMC article.
-
When novelty prevails on familiarity: Visual biases for child versus infant faces in 3.5- to 12-month-olds.J Exp Child Psychol. 2021 Oct;210:105174. doi: 10.1016/j.jecp.2021.105174. Epub 2021 Jun 15. J Exp Child Psychol. 2021. PMID: 34144347
Cited by
-
The effects of aging on the BTBR mouse model of autism spectrum disorder.Front Aging Neurosci. 2014 Sep 1;6:225. doi: 10.3389/fnagi.2014.00225. eCollection 2014. Front Aging Neurosci. 2014. PMID: 25225482 Free PMC article.
-
Familiarity and Novelty in Aesthetic Preference: The Effects of the Properties of the Artwork and the Beholder.Front Psychol. 2021 Jul 23;12:694927. doi: 10.3389/fpsyg.2021.694927. eCollection 2021. Front Psychol. 2021. PMID: 34367021 Free PMC article.
-
Preference for facial averageness: Evidence for a common mechanism in human and macaque infants.Sci Rep. 2017 Apr 13;7:46303. doi: 10.1038/srep46303. Sci Rep. 2017. PMID: 28406237 Free PMC article.
-
Self-Relevance Predicts the Aesthetic Appeal of Real and Synthetic Artworks Generated via Neural Style Transfer.Psychol Sci. 2023 Sep;34(9):1007-1023. doi: 10.1177/09567976231188107. Epub 2023 Aug 14. Psychol Sci. 2023. PMID: 37578091 Free PMC article.
-
A Theoretical Framework for How We Learn Aesthetic Values.Front Hum Neurosci. 2020 Sep 11;14:345. doi: 10.3389/fnhum.2020.00345. eCollection 2020. Front Hum Neurosci. 2020. PMID: 33061898 Free PMC article.
References
-
- Fantz RL. Pattern vision in newborn infants. Science. 1963;140:296–297. - PubMed
-
- Langrois JH, Roggman LA. Attractive faces are only average. Psychol Sci. 1990;1:115–121.
-
- Rhodes G, Jeffery L, Watson TL, Clifford CWG, Nakayama K. Fitting the mind to the world: Face adaptation and attractiveness aftereffects. Psychol Sci. 2003;14:558–566. - PubMed
-
- Fantz RL. Visual experience in infants: Decreased attention to familiar patterns relative to novel ones. Science. 1964;146:668–670. - PubMed
-
- Berlyne DE. Novelty, complexity, and hedonic value. Percept Psychophys. 1970;8:279–286.
Publication types
MeSH terms
Grants and funding
LinkOut - more resources
Full Text Sources
Miscellaneous
