. 2010 Oct 8;285(41):31427-34.
doi: 10.1074/jbc.M110.114496. Epub 2010 Aug 2.

Tumor-supportive and osteoclastogenic changes induced by breast cancer-derived factors are reversed by inhibition of {gamma}-secretase

Affiliations

Tumor-supportive and osteoclastogenic changes induced by breast cancer-derived factors are reversed by inhibition of {gamma}-secretase

Jenna E Fong et al. J Biol Chem. .

Abstract

During breast cancer metastasis to bone, tumor cells home to bone marrow, likely targeting the stem cell niche, and stimulate osteoclasts, which mediate osteolysis required for tumor expansion. Although osteoblasts contribute to the regulation of the hematopoietic stem cell niche and control osteoclastogenesis through production of proresorptive cytokine RANKL (receptor activator of NF-κB ligand), their role in cancer metastases to bone is not fully understood. C57BL/6J mouse bone marrow cells were treated for 3-12 days with ascorbic acid (50 μg/ml) in the presence or absence of 10% medium conditioned by breast carcinoma cells MDA-MB-231, 4T1, or MCF7. Treatment with cancer-derived factors resulted in a sustained 40-60% decrease in osteoblast differentiation markers, compared with treatment with ascorbic acid alone, and induced an osteoclastogenic change in the RANKL/osteoprotegerin ratio. Importantly, exposure of bone cells to breast cancer-derived factors stimulated the subsequent attachment of cancer cells to immature osteoblasts. Inhibition of γ-secretase using pharmacological inhibitors DAPT and Compound E completely reversed cancer-induced osteoclastogenesis as well as cancer-induced enhancement of cancer cell attachment, identifying γ-secretase activity as a key mediator of these effects. Thus, we have uncovered osteoblasts as critical intermediary of premetastatic signaling by breast cancer cells and pinpointed γ-secretase as a robust target for developing therapeutics potentially capable of reducing both homing and progression of cancer metastases to bone.


Figures
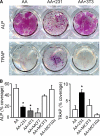
FIGURE 1.
FIGURE 1.
Breast cancer cells inhibit osteoblasts and stimulate osteoclasts. Mouse bone marrow cells were grown for 3–15 days with AA (50 μg/ml) without additions (open bars) or in the presence of MDA-MB-231, 4T1, or MCF7 CM (10%, shaded bars) or controls MC3T3-E1 CM (10%) and MCF10A CM (10%). A, representative images of cultures treated with AA only (AA, left), with AA and MDA-MB-231 CM (AA+231, center), or with AA and MC3T3-E1 CM (AA+3T3, right), fixed on day 6–9, and stained for ALP (red, upper) or TRAP (purple, lower). Scanned are the wells of a 24-well plate. B, average area covered on day 9 by ALP-positive cells (left) and on day 6 by TRAP-positive cells (right). Treatment with MDA-MB-231, 4T1, or MCF7 CM significantly reduced ALP-positive osteoblast staining (left). Treatment with MDA-MB-231 CM significantly increased TRAP-positive osteoclast staining (right). Supplementation of cultures with AA and conditioned medium from MC3T3 or MCF10A did not produce significantly different results from treatment with AA alone. Data are means ± S.E. (error bars), n = 2–6 independent experiments, p < 0.05.
FIGURE 2.
FIGURE 2.
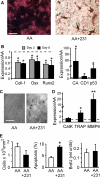
Breast cancer cells maintain osteoblasts in an immature state and induce differentiation of functional osteoclasts. A, bone marrow cells were grown for 12 days with AA (50 μg/ml) and β-glycerophosphate (10 mm) in the absence (left) or presence of MDA-MB-231 CM (10%, right). The cultures were fixed and stained for ALP (red) and mineralized deposits (black). Scale bar is 100 μm. B, bone marrow cells were grown for 3–9 days with AA (50 μg/ml) in the absence or presence of MDA-MB-231 CM (10%, left) or 4T1 CM (10%, right). Expression of Collagen-1 (Coll-1), osterix (Osx), and Runx2 was analyzed on day 3 (gray) or 9 (black). Expression of Cyclin A (CA), Cyclin D1 (CD1), and p53 was analyzed on day 9. Data are means ± S.E. (error bars), normalized to expression of β-actin (left) or GAPDH (right), and presented relative to levels observed in AA only samples (dashed line), n = 3–5 independent experiments, p < 0.05. C, bone marrow cells were grown for 9 days on dentin slices with AA (50 μg/ml) in the absence (left) or presence of MDA-MB-231 CM (10%, right), then the cells were removed, and dentin was stained with toluidine blue to reveal resorption pits. Scale bars represent 100 μm. D, expression of Cathepsin K (Cat K), TRAP, and MMP-9 was analyzed on day 9. Data are means ± S.E., normalized to expression of β-actin, and presented relative to levels observed in AA only samples (dashed line), n = 4–6 independent experiments, p < 0.05. E, bone marrow cells were grown for 9 days with AA (50 μg/ml) in the absence or presence of MDA-MB-231 CM (10%). The parallel samples were fixed, stained with DAPI nuclear stain, and the cell density was estimated (left). The rate of apoptosis was estimated as a proportion of cells demonstrating nuclear fragmentation from the total number of cells analyzed (center). Cell proliferation was measured by BrdU incorporation (right). Data are means ± S.E., n = 3–5 independent experiments, p < 0.05.
FIGURE 3.
FIGURE 3.
Breast cancer cells induce osteoclastogenic change in RANKL/OPG expression. Bone marrow cells were grown for 9 days with AA (50 μg/ml) in the absence (AA, open bars) or presence of MDA-MB-231 CM (10%, AA+231, filled bars). A, expression of RANKL and OPG normalized to expression of β-actin and presented relative to levels observed in cells grown with AA+231 for RANKL and AA only for OPG. Data are means ± S.E. (error bars), n = 5 independent experiments, p < 0.05. B, RANKL protein level assessed by immunoblotting in whole cell lysates. Shown is a representative immunoblot with α-tubulin as a loading control.
FIGURE 4.
FIGURE 4.
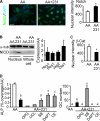
Notch signaling pathway is stimulated in bone cells by breast cancer-derived factors. Bone marrow cells were grown for 9 days with AA (50 μg/ml) in the absence (AA, open bars) or presence of MDA-MB-231 CM (10%, AA+231, black bars). A, NICD localization was assessed by immunofluorescence (green), and nuclei were stained using DAPI (blue). Left and center, representative images of negative (left) and positive (center) nuclear staining for NICD are shown. Scale bar is 20 μm. Right, nuclear intensity of NICD is quantified. Data are means ± S.E. (error bars), n = 3 independent experiments, p < 0.05. B, left, NICD level was assessed by immunoblotting in nuclear extracts and whole cell lysates. Shown is a representative immunoblot with α-tubulin as a loading control. Right, expression of the transcriptional targets of the NICD, Hey-1 and Hes-1, and Notch ligands Jag-2 and Delta1 (Dta1) was analyzed on day 9. Data are means ± S.E., normalized to expression of β-actin for Hey-1 and Hes-1 or GAPDH for Jag-2 and Delta1 and presented relative to levels observed in cells grown with AA only (dashed line), n = 3 independent experiments. C, nuclear intensity of β-catenin (β-Cat) is shown. Data are means ± S.E., n = 3 independent experiments, p < 0.05. D, bone marrow cells were grown for 9 days with AA (50 μg/ml), MDA-MB-231 CM (10%), and the following inhibitors (gray bars): OPG (500 ng/ml), LiCl (10 mm), SB216763 (SB, 10 μm), DAPT (100 nm), or CE (100 nm). The parallel samples were fixed and stained for ALP or TRAP. Left, area covered by ALP-positive cells was normalized to the samples grown with AA only. Right, number of TRAP-positive osteoclastic cells was counted in the same experiments. Data are means ± S.E., n = 3–6 independent experiments except for OPG and LiCl data, where n = 3 replicates; different letters indicate significant difference at p < 0.05.
FIGURE 5.
FIGURE 5.
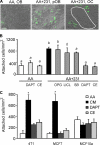
Exposure to breast cancer-derived factors enhances subsequent breast cancer cell attachment to immature osteoblasts. Bone marrow cells were grown for 9 days with AA (50 μg/ml) in the absence (AA, open bars) or presence of MDA-MB-231 CM (10%), combined with vehicle (AA+231, black bars) or the following inhibitors (gray bars): OPG (500 ng/ml), LiCl (10 mm), SB216763 (SB, 10 μm), DAPT (100 nm), or Compound E (CE, 100 nm). The MDA-MB-231 cells were labeled with Cell Tracker Green and added to bone marrow cultures for 40 min, and then the cultures were washed to remove nonattached cells, fixed, and analyzed. A, representative images demonstrate attachment of breast cancer cells (green) to mature osteoblasts (OB) in cultures treated with AA only (left); to immature osteoblast precursors (pOB) in cultures treated with AA and MDA-MB-231 CM (center); or to osteoclasts (OC, white outline) in cultures treated with AA and MDA-MB-231 CM (right). Scale bar is 20 μm. B, significantly more breast cancer cells attached to bone marrow cultures treated with AA and MDA-MB-231 CM compared with cultures treated with AA alone. Inhibitors of γ-secretase DAPT and CE prevented this effect of MDA-MB-231 CM, whereas glycogen synthase kinase inhibitors and OPG were ineffective. Data are means ± S.E. (error bars), n = 2–6 independent experiments; different letters indicate significant difference at p < 0.05. C, bone marrow cells were grown for 9 days with AA (50 μg/ml) in the absence (AA, open bars) or presence of 4T1, MCF7, or MCF10A CM (10%), either alone (CM, black bars) or with γ-secretase inhibitors DAPT (100 nm) or CE (100 nm). The same cells as were used for CM treatment were labeled with Cell Tracker Green and added to bone marrow cultures for 40 min. Treatment with 4T1 or MCF7 CM significantly increased attachment of these cells to bone marrow cultures, which was inhibited by γ-secretase inhibitors. Data are means ± S.E., n = 3 independent experiments, p < 0.05.

Similar articles

Cited by

References

    1. Coleman R. E. (2006) Clin. Cancer Res. 12, 6243S–6249S - PubMed
    1. Kim C. J., Bland K. I., Yeatman T. J. (2004) The Breast Comprehensive Management of Benign and Malignant Disorders, W. B. Saunders, Philadelphia, PA
    1. Hattner R., Epker B. N., Frost H. M. (1965) Nature 206, 489–490 - PubMed
    1. Stenbeck G. (2002) Semin. Cell Dev. Biol. 13, 285–292 - PubMed
    1. Deng Z. L., Sharff K. A., Tang N., Song W. X., Luo J., Luo X., Chen J., Bennett E., Reid R., Manning D., Xue A., Montag A. G., Luu H. H., Haydon R. C., He T. C. (2008) Front. Biosci. 13, 2001–2021 - PubMed

Publication types

MeSH terms

Substances