. 2010 Oct 8;285(41):31647-60.
doi: 10.1074/jbc.M110.148429. Epub 2010 Aug 2.

Nucleobindin 1 is a calcium-regulated guanine nucleotide dissociation inhibitor of G{alpha}i1

Affiliations

Nucleobindin 1 is a calcium-regulated guanine nucleotide dissociation inhibitor of G{alpha}i1

Neeraj Kapoor et al. J Biol Chem. .

Abstract

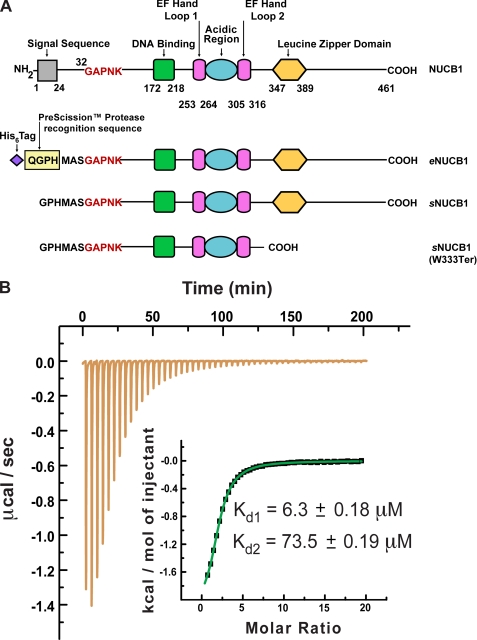
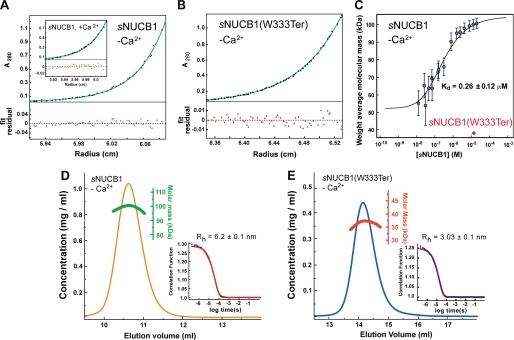
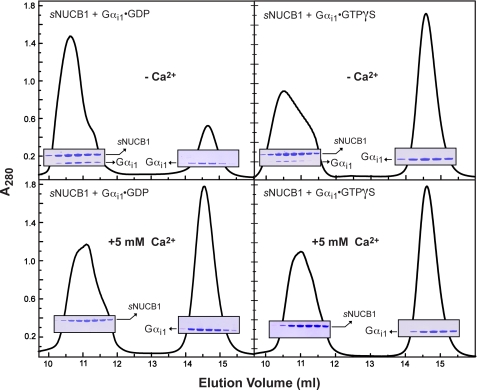
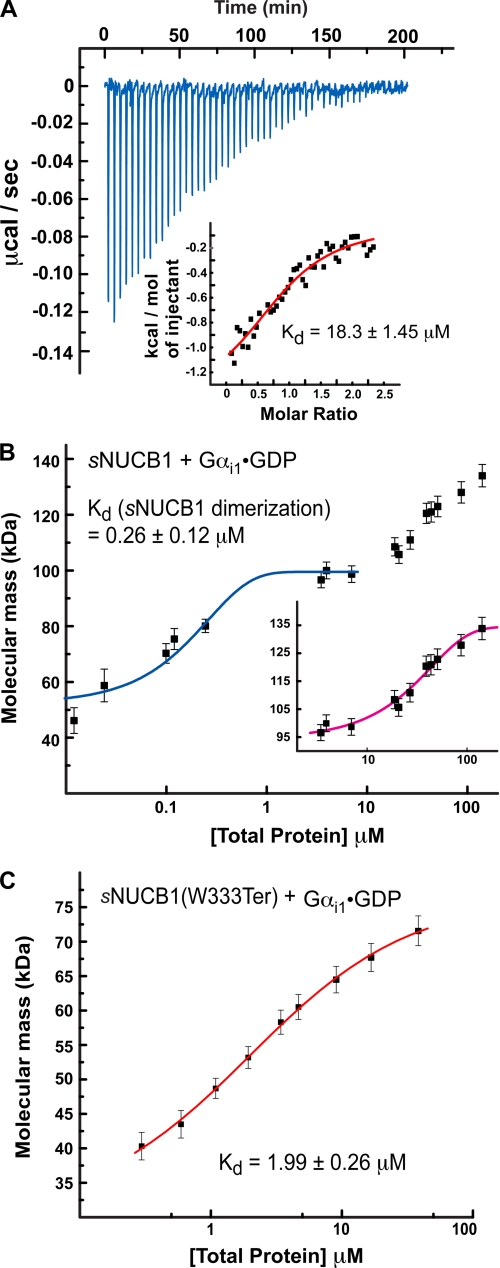
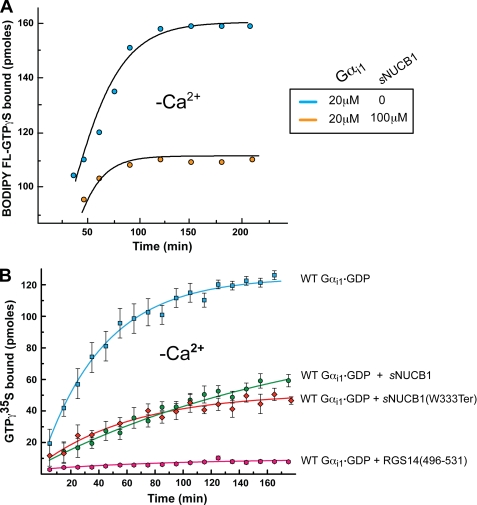
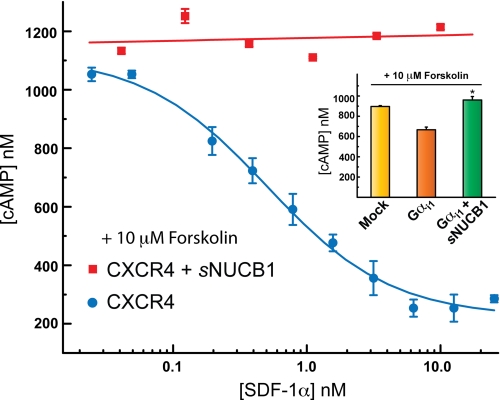
Nucleobindin 1 (NUCB1) is a widely expressed multidomain calcium-binding protein whose precise physiological and biochemical functions are not well understood. We engineered and heterologously expressed a soluble form of NUCB1 (sNUCB1) and characterized its biophysical and biochemical properties. We show that sNUCB1 exists as a dimer in solution and that each monomer binds two divalent calcium cations. Calcium binding causes conformational changes in sNUCB1 as judged by circular dichroism and fluorescence spectroscopy experiments. Earlier reports suggested that NUCB1 might interact with heterotrimeric G protein α subunits. We show that dimeric calcium-free sNUCB1 binds to expressed Gα(i1) and that calcium binding inhibits the interaction. The binding of sNUCB1 to Gα(i1) inhibits its basal rate of GDP release and slows its rate and extent of GTPγS uptake. Additionally, our tissue culture experiments show that sNUCB1 prevents receptor-mediated Gα(i)-dependent inhibition of adenylyl cyclase. Thus, we conclude that sNUCB1 is a calcium-dependent guanine nucleotide dissociation inhibitor (GDI) for Gα(i1). To our knowledge, sNUCB1 is the first example of a calcium-dependent GDI for heterotrimeric G proteins. We also show that the mechanism of GDI activity of sNUCB1 is unique and does not arise from the consensus GoLoco motif found in RGS proteins. We propose that cytoplasmic NUCB1 might function to regulate heterotrimeric G protein trafficking and G protein-coupled receptor-mediated signal transduction pathways.


Figures

FIGURE 1.
FIGURE 1.
Domain architecture of human NUCB1 and engineered NUCB1 variants and Ca2+-binding activity of a soluble NUCB1 variant. A, modular nature of the NUCB1 protein structure is depicted schematically with its N-terminal signal sequence (gray square), putative DNA binding domain (green square), two EF hand loops (magenta rectangles), acidic region (blue oval), and leucine zipper domain (yellow hexagon). The amino acid residues at domain borders are numbered. We engineered a construct for expression in E. coli of a soluble form of NUCB1 that included an N-terminal His6 tag and a PreScission protease recognition sequence with an intervening spacer sequence as shown. Endoprotease cleavage yields a soluble form of NUCB1 that begins with the amino acid sequence GPHMAS and continues with the remainder of the native sequence beginning at Gly-32. We refer to this expressed protein construct as soluble NUCB1 or sNUCB1 throughout the text. We also constructed a double replacement mutant sNUCB1(W232A/W333A) and a truncation mutant sNUCB1(W333Ter) as shown. B, we used isothermal titration calorimetry (ITC) to measure the Ca2+-binding affinity of sNUCB1. sNUCB1 presumably binds one Ca2+ cation at each of its two EF hand domains, and a nonlinear least squares fit of the calculated values using the two-set of sites model resulted in an excellent fit as shown in the inset. The calculated dissociation constants for Ca2+ binding to the two EF hand domains of sNUCB1 are 6.3 ± 0.18 and 73.5 ± 0.19 μm, respectively.
FIGURE 2.
FIGURE 2.
sNUCB1 forms a stable dimer mediated by its leucine zipper domain. A, we carried out AUC experiments to determine the oligomeric state of sNUCB1 in solution. The sedimentation equilibrium plot for Ca2+-free sNUCB1 (50 μm monomeric concentration) shows the evolution of a sample concentration curve resulting from the applied centrifugal force. The data were fit to a monomer-n-mer equilibrium model, which gave a measured molecular mass of 98.9 ± 0.41 kDa, consistent with a dimeric structure for sNUCB1 in solution (the theoretical molecular mass of monomeric sNUCB1 is ∼51 kDa). The inset shows the sedimentation equilibrium plot for Ca2+-bound sNUCB1, which gave essentially an identical molecular mass of 99.4 ± 0.78 kDa. B, AUC experiments were carried out on the truncation mutant, sNUCB1(W333Ter), which lacked the leucine zipper domain in the C-terminal region of the protein. The AUC sedimentation equilibrium plot for Ca2+-free sNUCB1(W333Ter) (70 μm monomeric concentration) gave a molecular mass of 35.2 ± 0.05 kDa, consistent with a monomeric species in solution (the theoretical molecular mass of sNUCB1(W333Ter) is ∼36.8 kDa). C, we studied the monomer-dimer equilibrium of sNUCB1 with MALS of fractions with increasing protein concentration collected from Superdex200 10/30 HR size-exclusion chromatography in 50 mm Tris-HCl, pH 8.0, 150 mm NaCl. The weight average molecular weight of the complex at a given protein concentration was determined from a nonlinear least square fit of a collection of values determined for the apex fractions of each eluting peak. A monomer-dimer association model of the values as a function of sNUCB1 concentration gave an apparent dissociation constant (Kd) for dimerization of 0.26 ± 0.12 μm. The error bars indicate the extent of variation in molecular mass determination originating from the light scattering measurement. We next measured DLS chromatograms for sNUCB1 (D) and sNUCB1(W333Ter) (E). Each protein sample was injected onto a Superdex200 10/30 HR column, and the refractive index detector was used to analyze the protein peak. The change in refractive index as a function of protein concentration was used to compute the molecular mass as shown in green for sNUCB1 and red for sNUCB1(W333Ter). The molecular mass corresponds to a dimer for sNUCB1 and a monomer for sNUCB1(W333Ter). The insets show the correlation functions as each protein diffuses through the solution in the DLS experiment. The diffusion coefficient from the correlation function gives the hydrodynamic radius (Rh) using Stokes equation. The computed Rh values were 6.2 and 3.03 nm for sNUCB1 and sNUCB1(W333Ter), respectively.
FIGURE 3.
FIGURE 3.
sNUCB1 forms a stable complex with Gαi1·GDP only in the absence of Ca2+. We used size-exclusion chromatography to determine the nature of the interaction between sNUCB1 and Gαi1 in solution under several conditions. sNUCB1 and Gαi1·GDP were incubated together in the absence (upper left) or presence (lower left) of Ca2+, and the mixture was subjected to size-exclusion chromatography using a Superdex200 10/30 HR column. Peak fractions were analyzed by SDS-PAGE with Coomassie Brilliant Blue staining as shown in the insets. In the absence of Ca2+, sNUCB1 and Gαi1·GDP formed a complex as judged by the following: (i) the slight shift (from ∼11.2 to 10.6 ml) and enhancement of the peak containing only sNUCB1 in the presence of Ca2+ and both sNUCB1 and Gαi1 in the absence of Ca2+, and (ii) the depletion, in the absence of Ca2+, of the peak eluting at about 14.6 ml, which contained only Gαi1. The same experiment was repeated with sNUCB1 and Gαi1·GTPγS in the absence (upper right) or presence (lower right) of Ca2+. Although the same general trend and Ca2+ dependence were observed, the apparent ability of Gαi1·GTPγS to form a stable complex with sNUCB1 was markedly diminished compared with that of Gαi1·GDP.
FIGURE 4.
FIGURE 4.
Interaction of sNUCB1 and Gαi1·GDP. A, we used ITC to measure the binding of Ca2+-free sNUCB1 to Gαi1·GDP. The heat released per injection of aliquots of a solution of Gαi1·GDP (200 μm) into a buffered solution of Ca2+-free sNUCB1 (50 μm) was recorded, and the area under the curve was integrated. The heat of dilution for the addition of Gαi1·GDP to buffer alone was subtracted. A nonlinear least squares fit of the calculated values using the one-set of sites model for dimeric sNUCB1 resulted in a satisfactory fit with a dissociation constant of 18.3 ± 1.45 μm as shown in the inset. We used MALS to measure the formation of a complex between sNUCB1 and Gαi1·GDP (B) or the truncation mutant sNUCB1(W333Ter) and Gαi1·GDP (C). MALS data were collected on protein complex peaks eluting from Superdex200 10/30 HR size-exclusion chromatography connected to a high performance liquid chromatography system equipped with an autosampler. Samples with increasing protein concentrations were successively injected onto the column, and the eluate was monitored using a photo-diode UV-visible detector, a differential refractometer, and a static multiangle laser light scattering detector. The weight average molecular weight of the complex was determined as a function of increasing protein concentrations. The magenta curve in B, inset, and the red curve in C indicate nonlinear least square fits for a complex formation model of weight average molecular weight values determined for the apex of each eluting peak at various concentrations. The error bars indicate extent of variation in molecular mass determination originating from the light-scattering measurement. The data for sNUCB1-Gαi1·GDP complex formation shows that association between the protein subunits occurs only after dimerization of sNUCB1 (blue curve). The data suggest that one Gαi1 subunit binds to a dimer of sNUCB1 and a monomer of sNUCB1(W333Ter), respectively, and that the binding site for Gαi1 lies in the sNUCB1(W333Ter) sequence.
FIGURE 5.
FIGURE 5.
Evidence that sNUCB1 acts as a GDI of Gαi1. A, we estimated the number of available nucleotide-binding sites on Gαi1 in the absence or presence of Ca2+-free sNUCB1 by monitoring the absorbance of Gαi1-bound BODIPY FL-GTPγS at 504 nm. Gαi1·GDP alone (20 μm, black) or in complex with Ca2+-free sNUCB1 (100 μm, red) was allowed to undergo nucleotide exchange with 100 μm BODIPY FL-GTPγS in the reaction mixture. Samples were withdrawn at different time points, and unbound BODIPY FL-GTPγS was removed using a micro-spin desalting column. The amount of bound BODIPY FL-GTPγS was measured using the UV-visible absorbance spectroscopy at each time point. A relative decrease in the number of nucleotide-binding sites on Gαi1 was observed on association with sNUCB1. This shows that Ca2+-free sNUCB1 binds to Gαi1 in its GDP-bound form and inhibits nucleotide exchange. We further investigated the guanine nucleotide inhibitory activity of Ca2+-free sNUCB1 using the radioligand-based binding assay (B). WT Gαi1·GDP (20 μm) was incubated alone (blue) or with 100 μm Ca2+-free sNUCB1 (green)/sNUCB1(W333Ter) (red) in the presence of [35S]GTPγS, and samples were withdrawn at various time points to estimate the amount of radioligand bound upon nucleotide exchange. As a positive control, 100 μm of a C-terminal GoLoco motif peptide from RGS14, namely RGS14(496–531), with established GDI activity was used as a positive control (magenta). The data show that both Ca2+-free sNUCB1 or Ca2+-free sNUCB1(W333Ter) considerably inhibits nucleotide exchange with similar potency. The GDI peptide RGS14(496–531) shows complete inhibition of nucleotide exchange. Each experiment was repeated at least three times, and the data were plotted as mean ± S.E. among the independent measurements.
FIGURE 6.
FIGURE 6.
sNUCB1 overexpression decreases apparent Gαi1-dependent inhibition of AC. The physiological role of interaction of sNUCB1 with Gαi1 was investigated by monitoring its effect on cellular cAMP production. We transfected HEK293 cells with CXCR4 alone (blue) or with sNUCB1 and CXCR4 (red) cDNA and monitored cAMP production upon ligand (SDF1α)-mediated receptor activation. To increase basal cAMP levels through AC activation at each ligand concentration, cells were stimulated with 10 μm forskolin. For CXCR4 alone (blue), we observe significant inhibition of cAMP production upon stimulation with increasing concentrations of receptor agonist ligand. However, upon co-expression of sNUCB1 with CXCR4, ligand-dependent receptor-mediated inhibition of cAMP production is markedly reduced (red). In the inset, we transfected HEK293 cells with mock (yellow), Gαi1 alone (orange), and with sNUCB1 and Gαi1 (green) cDNA, respectively, and then measured cAMP production. The bar in yellow shows the concentration of cAMP produced with mock transfection, and the bar in orange shows cAMP production with overexpression of Gαi1 alone, and the bar in green shows cAMP production when sNUCB1 was transfected with Gαi1. The expression of sNUCB1 results in significant enhancement of cAMP production. The results suggest that sNUCB1 affects the ability of Gαi1 to promote forskolin-stimulated cAMP production by AC; *, p < 0.05.

Similar articles

Cited by

References

    1. Oldham W. M., Hamm H. E. (2008) Nat. Rev. Mol. Cell Biol. 9, 60–71 - PubMed
    1. Sakmar T. P., Menon S. T., Marin E. P., Awad E. S. (2002) Annu. Rev. Biophys. Biomol. Struct. 31, 443–484 - PubMed
    1. Gilman A. G. (1987) Annu. Rev. Biochem. 56, 615–649 - PubMed
    1. Pierce K. L., Premont R. T., Lefkowitz R. J. (2002) Nat. Rev. Mol. Cell Biol. 3, 639–650 - PubMed
    1. McCudden C. R., Hains M. D., Kimple R. J., Siderovski D. P., Willard F. S. (2005) Cell. Mol. Life Sci. 62, 551–577 - PMC - PubMed

Publication types

MeSH terms

LinkOut - more resources