. 2010 Oct 15;285(42):32476-85.
doi: 10.1074/jbc.M110.141028. Epub 2010 Aug 2.

Differential effects of ceramide and sphingosine 1-phosphate on ERM phosphorylation: probing sphingolipid signaling at the outer plasma membrane

Affiliations

Differential effects of ceramide and sphingosine 1-phosphate on ERM phosphorylation: probing sphingolipid signaling at the outer plasma membrane

Daniel Canals et al. J Biol Chem. .

Abstract

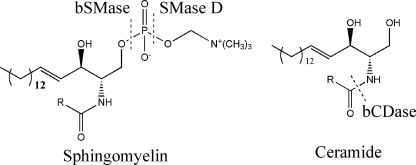
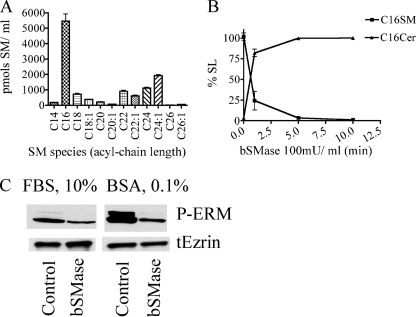
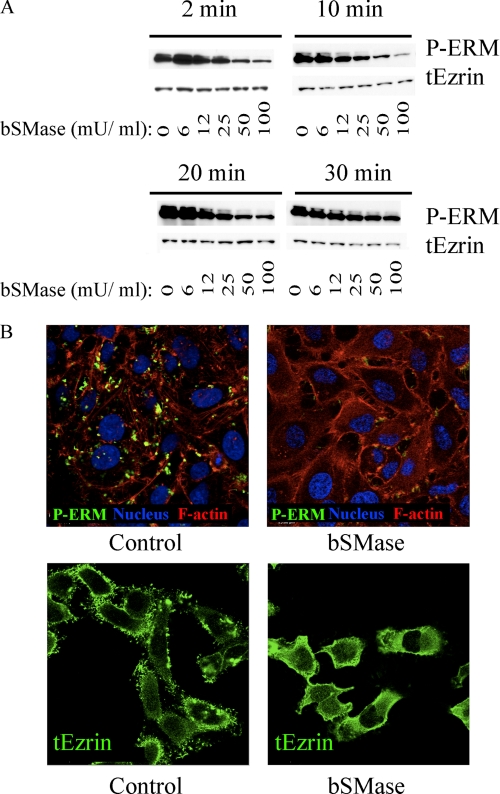
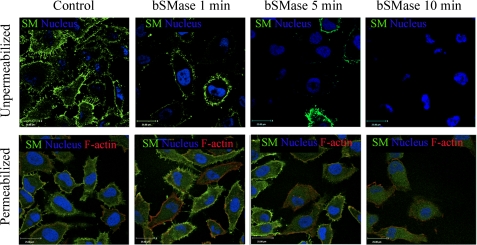
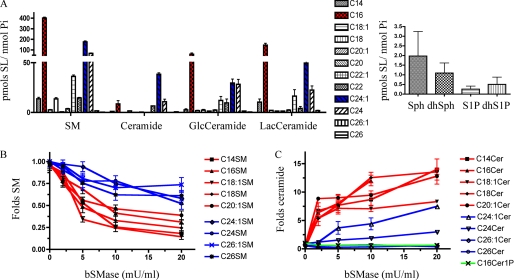
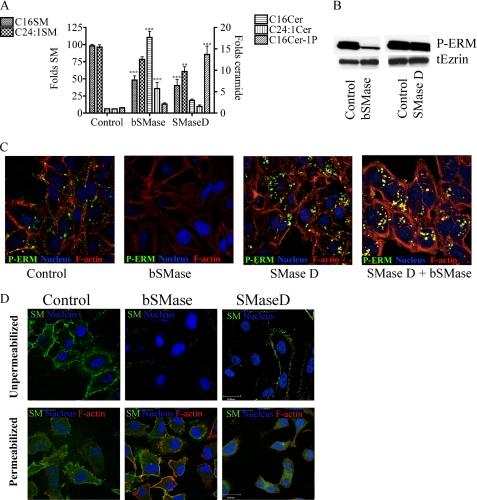
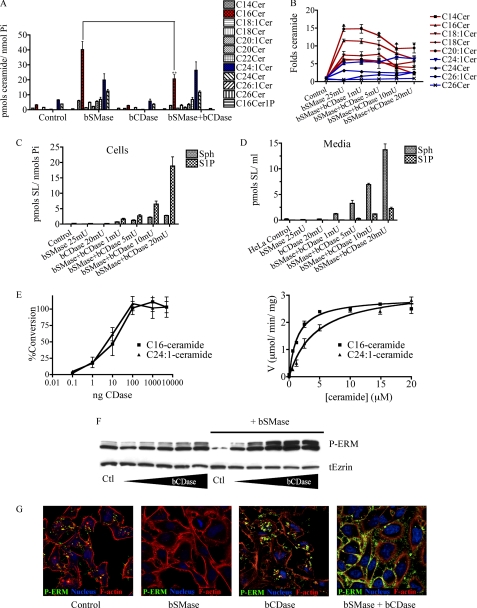
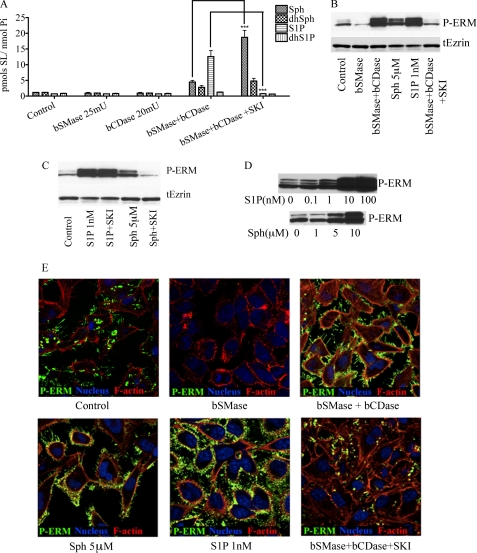
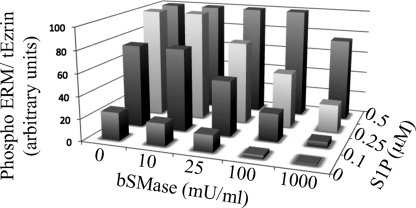
ERM proteins are regulated by phosphorylation of the most C-terminal threonine residue, switching them from an activated to an inactivated form. However, little is known about the control of this regulation. Previous work in our group demonstrated that secretion of acid sphingomyelinase acts upstream of ERM dephosphorylation, suggesting the involvement of sphingomyelin (SM) hydrolysis in ERM regulation. To define the role of specific lipids, we employed recombinant bacterial sphingomyelinase (bSMase) as a direct probe of SM metabolism at the plasma membrane. bSMase induced a rapid dose- and time-dependent decrease in ERM dephosphorylation. ERM dephosphorylation was driven by ceramide generation and not by sphingomyelin depletion, as shown using recombinant sphingomyelinase D. The generation of ceramide at the plasma membrane was sufficient for ERM regulation, and no intracellular SM hydrolysis was required, as was visualized using Venus-tagged lysenin probe, which specifically binds SM. Interestingly, hydrolysis of plasma membrane bSMase-induced ceramide using bacterial ceramidase caused ERM hyperphosphorylation and formation of cell surface protrusions. The effects of plasma membrane ceramide hydrolysis were due to sphingosine 1-phosphate formation, as ERM phosphorylation was blocked by an inhibitor of sphingosine kinase and induced by sphingosine 1-phosphate. Taken together, these results demonstrate a new regulatory mechanism of ERM phosphorylation by sphingolipids with opposing actions of ceramide and sphingosine 1-phosphate. The approach also defines a tool kit to probe sphingolipid signaling at the plasma membrane.


Figures

FIGURE 1.
FIGURE 1.
Hydrolysis of sphingomyelin and ceramide with the exogenous enzymes used in this work.
FIGURE 2.
FIGURE 2.
Effects of bSMase on sphingomyelin in FBS medium. A, the SL profile was measured in FBS medium, and different species of SM were detected. B, after bSMase treatment (25 milliunits (mU)/ml), ceramide formation was measured. Only the C16 acyl chain is shown for clarity, but all sphingomyelin species had similar kinetics. C, HeLa cells were cultured in 10% FBS-containing DMEM medium or FBS-free medium and treated with bSMase (25 milliunits/ml for 10 min), and phospho-medium and total ezrin were measured by Western blotting.
FIGURE 3.
FIGURE 3.
BSMase effects on ERM dephosphorylation. A, HeLa cells were treated with vehicle or with different doses of bSMase: 6, 12, 25, 50, and 100 milliunits (mU)/ml for 2, 10, 20, and 30 min. Phospho-ERM and total ezrin were analyzed by Western blotting. B, HeLa cells were treated with vehicle bSMase (25 milliunits/ml, 10 min) and stained with phospho-ERM specific antibody (P-ERM, green). Nuclei and F-actin were visualized with Draq5 (blue) and rhodamine phalloidin (red) staining or stained with total ezrin antibody (tEzrin, green).
FIGURE 4.
FIGURE 4.
Effects of bSMase on plasma membrane and intracellular SM. Presence of SM was monitored by lysenin-Venus (green channel) binding to SM after bSMase treatment (25 milliunits/ml). Cells were fixed, and the nonpermeabilized (upper panels) or permeabilized (lower panels) cells were analyzed by confocal microscope. Nuclei was visualized with Draq5 (blue), and in permeabilized cells, F-actin was visualized with rhodamine phalloidin staining (red).
FIGURE 5.
FIGURE 5.
Changes in SLs after bSMase treatment in HeLa cells. A, the SL profile of HeLa cells was measured in serum-free conditions. C16 (red), C24:1 (blue), and C24 were the main acyl chains among the different acyl chain species analyzed. Sph and S1P and their dihydro (dh) forms were also measured. B, levels of SM and ceramide species. After bSMase treatment (25 milliunits (mU)/ml, 10 min), the SL profile was monitored, and only SL species that underwent significant changes are presented (red, LC species; blue, VLC species): Sphingomyelin (B) and ceramide (C) species. GlcCeramide, glucosyl ceramide; LacCeramide, lactosyl ceramide; Cer, ceramide.
FIGURE 6.
FIGURE 6.
Effects of depletion of SM versus ceramide generation on ERM proteins. A, HeLa cells were cultured in FBS-free medium for 2 h and treated with bSMase (25 milliunits/ml) or SMase D (300 milliunits/ml) to cause the same fold decrease in SM species for 10 min, and ceramide (Cer) and ceramide 1-phosphate were monitored. B, HeLa cells were treated with bSMase or SMase D as before and phospho-ERM, and total ezrin was measured by Western blotting. C, HeLa cells were treated with bSMase (10 min), SMase D (10 min), or with SMase D (10 min), and then with bSMase (10 min) and stained against phospho-ERM (green), actin filaments (stained with rhodamine phalloidin, red) and nuclei (stained with Draq5, blue). D, HeLa cells were treated with bSMase or SMase D as in A, and the presence of SM was monitored by lysenin-Venus (green channel). Cells were fixed, and the nonpermeabilized (upper panels) or permeabilized (lower panels) cells were analyzed by confocal microscope. Nuclei were visualized with Draq5 (blue) and in permeabilized cells F-actin was visualized with rhodamine phalloidin staining (red). tEzrin, total ezrin.
FIGURE 7.
FIGURE 7.
Effect of bCDase on SL profile and ERM proteins. A, HeLa cells were treated with bSMase (25 milliunits (mU)/ml), bCDase (20 milliunits/ml), or with bSMase and bCDase together, and the levels of the different species of ceramide were analyzed by mass spectrometry (red, C16 ceramide; blue, C24:1 ceramide). B, HeLa cells were treated with bSMase (25 milliunits/ml) and different amounts of bCDase, and the fold change in different ceramide species are presented; long chain species are displayed in red, and very long chain species are shown in blue. C and D, after bSMase and bCDase treatment, Sph and S1P levels were measured in cells (C) and in medium (D). E, the amount of protein required for in vitro assays were ∼5000 times less (1 ng) than those required for in vivo assays (left panel). In vitro kinetics of bCDase on pure C16 (Km 1.4 ± 0.1) and C24:1 (Km 4.6 ± 0.8) ceramide species are shown (right panel). F, HeLa cells were treated with different doses of bCDase (1, 2, 5, 10, and 20 milliunits/ml) and treated with both bSMase (25 milliunits/ml) and different doses of bCDase, and the effect on phospho-ERM and total ezrin (tEzrin) were studied by Western blotting. G, HeLa cells were treated with bSMase (25 milliunits/ml), bCDase (20 milliunits/ml), or co-treated with both, and phospho-ERM (green) was analyzed by confocal microscopy. Nuclei (stained with Draq5, blue) and F-actin (stained with rhodamine phalloidin, red) were also visualized.
FIGURE 8.
FIGURE 8.
Differential effects of S1P, Sph, and long-chain ceramides on ERM. A, HeLa cells were treated with bSMase (25 milliunits/ml), bCDase (20 milliunits/ml), or both of them, and pretreated with either vehicle or sphingosine kinase inhibitor (SKI, 10 mm for 6 h), and the levels of Sph and S1P, as well as their dihydro forms were measured. B, phospho-ERM and total ezrin were measured by Western blotting in HeLa cells after being treat with vehicle, bSMase, bSMase, and bCDase together, exogenous Sph (5 μm), exogenous S1P (1 nm), and with bSMase (25 milliunits/ml) and bCDase (20 milliunits/ml) in cells pretreated 6 h with SKI. C, phospho-ERM levels after being treated with S1P (1 nm) or Sph (5 μm) in presence or absence of sphingosine kinase inhibitor (SKI, 10 mm, 6-h pretreatment). D, phospho-ERM levels after being treated with different doses of S1P or Sph. E, HeLa cells were treated in the same way that in B and stained for phospho-ERM (green). Nuclei (stained with Draq5, blue) and F-actin (stained with rhodamine phalloidin, red) also were visualized.
FIGURE 9.
FIGURE 9.
Balance between ceramide and S1P. HeLa cells were treated with different concentrations of bSMase, and for each bSMase treatment were also treated with different amounts of S1P. After 5 min of treatment, cells were harvested, and the phospho-ERM protein was detected by Western blotting, quantified, and normalized by total ezrin signal.

References

    1. Bretscher A., Edwards K., Fehon R. G. (2002) Nat. Rev. Mol. Cell Biol. 3, 586–599 - PubMed
    1. Lamb R. F., Ozanne B. W., Roy C., McGarry L., Stipp C., Mangeat P., Jay D. G. (1997) Curr. Biol. 7, 682–688 - PubMed
    1. Serrador J. M., Alonso-Lebrero J. L., del Pozo M. A., Furthmayr H., Schwartz-Albiez R., Calvo J., Lozano F., Sánchez-Madrid F. (1997) J. Cell Biol. 138, 1409–1423 - PMC - PubMed
    1. Li Y., Harada T., Juang Y. T., Kyttaris V. C., Wang Y., Zidanic M., Tung K., Tsokos G. C. (2007) J. Immunol. 178, 1938–1947 - PubMed
    1. Zohar R., Suzuki N., Suzuki K., Arora P., Glogauer M., McCulloch C. A., Sodek J. (2000) J. Cell. Physiol. 184, 118–130 - PubMed

Publication types

MeSH terms

LinkOut - more resources