

doi: 10.1101/gad.1942810.
Defective erythroid differentiation in miR-451 mutant mice mediated by 14-3-3zeta
Affiliations
- PMID: 20679397
- PMCID: PMC2912559
- DOI: 10.1101/gad.1942810
Item in Clipboard
Defective erythroid differentiation in miR-451 mutant mice mediated by 14-3-3zeta
Genes Dev.
.
Abstract
Erythrocyte formation occurs throughout life in response to cytokine signaling. We show that microRNA-451 (miR-451) regulates erythropoiesis in vivo. Mice lacking miR-451 display a reduction in hematrocrit, an erythroid differentiation defect, and ineffective erythropoiesis in response to oxidative stress. 14-3-3zeta, an intracellular regulator of cytokine signaling that is repressed by miR-451, is up-regulated in miR-451(-/-) erythroblasts, and inhibition of 14-3-3zeta rescues their differentiation defect. These findings reveal an essential role of 14-3-3zeta as a mediator of the proerythroid differentiation actions of miR-451, and highlight the therapeutic potential of miR-451 inhibitors.
Figures
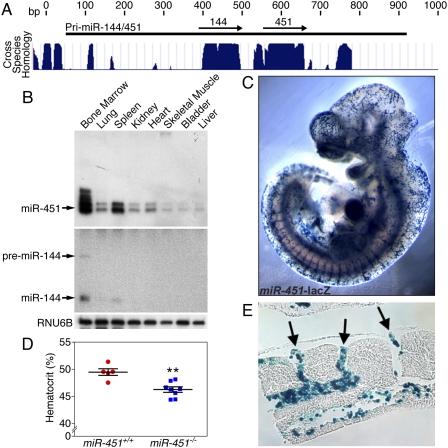
miR-451 is expressed in erythrocytes, and miR-451−/− mice display a reduction in hematocrit. (A) A schematic showing the genomic location of the miR-144/451 transcription unit. Mammalian conservation is represented as a histogram. (B) Northern blot analysis of miR-451 and miR-144 expression across multiple tissues. Pre-miR-144 is denoted with an arrow. Pre-miR-451 is not detected. (C) Expression of β-gal driven by the miR-451 enhancer is restricted to the circulatory system at 13.5 dpc. (D) Hematocrit measurements represented as a dot plot. Data from miR-451+/+ (n = 5) and miR-451−/− (n = 8) animals are shown as means ± SEM. (**) P < 0.01. (E) Cross-section through the intersomitic veins reveals β-gal positivity of circulating erythrocytes.
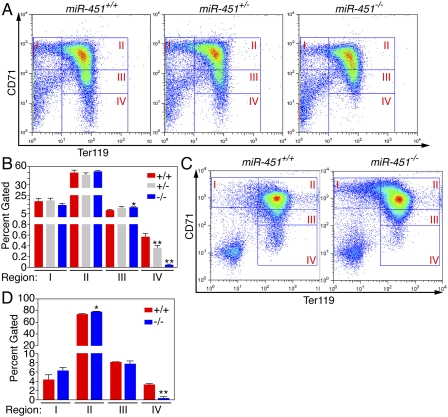
miR-451−/− animals display an embryonic erythroid differentiation defect. (A) FACS analysis of fetal livers harvested from embryos 16.5 dpc and stained for CD71 and TER119. Erythrocytes progress from regions I–IV throughout differentiation, with the most mature erythrocytes represented in region IV. Representative FACS plots from one litter at each time point are shown. (B) Quantitation of percent of cells gated within each region. Data from a representative litter of miR-451+/+ (n = 3), miR-451+/− (n = 4), and miR-451−/− (n = 2) animals are shown as means ± SEM. (*) P < 0.05; (**) P < 0.01. (C) FACS analysis of in vitro differentiated TER119-depleted 14.5-dpc fetal liver 3 d post-induction by EPO. Cells were stained for CD71 and TER119. Representative FACS plots from one litter are shown. (D) Quantitation of percent of cells gated within each region. Data from miR-451+/+ (n = 2) and miR-451−/− (n = 3) animals are shown as means ± SEM. (*) P < 0.05; (**) P < 0.01.
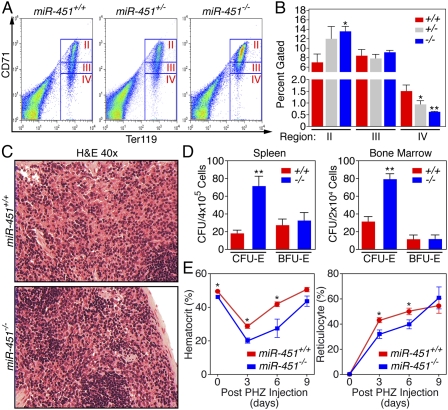
miR-451−/− mice display an erythroid differentiation defect in adulthood and cannot sustain a high rate of erythropoiesis. (A) FACS analysis of bone marrow harvested from 8-wk-old male littermates stained for CD71 and TER119. Representative FACS plots from one litter are shown. (B) Quantitation of percent of cells gated within each region. Data from miR-451+/+ (n = 3), miR-451+/− (n = 5), and miR-451−/− (n = 3) animals are shown as means ± SEM. (*) P < 0.05; (**) P < 0.01. (C) Hematoxylin and eosin-stained sections of spleens harvested from 8-wk-old male littermate miR-451+/+ and miR-451−/− animals. Increased cellularity is observed at 40× magnification. (D) Colony--formation assays for CFU-E and BFU-E were performed on three independent sets of miR-451+/+ and miR-451−/− littermates. Data from a representative set of littermates are displayed, with n = 2 assays for each animal. Data are shown as means ± SEM. (**) P < 0.01. (E) PHZ was injected in miR-451−/− and miR-451+/+ animals on days 0, 1, and 3. Hematocrit values and reticulocyte counts were obtained on days 0, 3, 6, and 9. Data from miR-451+/+ (n = 5) and miR-451−/− (n = 8) animals are shown as means ± SEM. (*) P < 0.05.
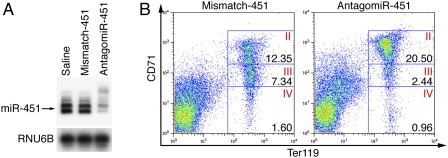
miR-451 inhibition with antagomir-451 rapidly induces a defect in erythroid differentiation. (A) Northern blot analysis of miR-451 in bone marrow of animals injected with either saline, mismatch, or antagomir-451 shows 90% knockdown of miR-451. (B) FACS analysis was performed on bone marrow stained with CD71 and TER119. Percentage of cells gated are displayed within the respective gate
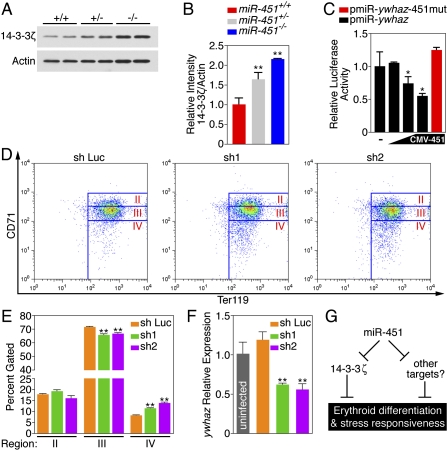
miR-451 repression of 14-3-3ζ regulates erythroid differentiation. (A) Immunoblot analysis for 14-3-3ζ on protein harvested from 14.5 dpc fetal liver TER119+ erythrocytes. Two individual animals from each genotype were run in adjacent lanes. (B) Densitometry analysis of the immunoblot shown in A. Data are shown as means ± SEM. (**) P < 0.01. (C) A luciferase reporter construct fused to the ywhaz 3′ UTR is repressed by miR-451 in a dose-dependent manner. Mutation of this binding site abolishes miR-451-mediated repression. Data from n = 3 per condition are shown as means ± SEM. (*) P < 0.05. (D) FACS analysis of in vitro differentiated TER119-depleted 14.5-dpc miR-451−/− fetal liver cells 3 d post-induction by EPO. Cells shown are GFP-positive, representing viability and expression of one of two shRNAs targeted against 14-3-3ζ (sh-1 and sh-2) or against Luciferase (sh-Luc) as a control. Cells were stained for CD71 and TER119. Representative FACS plots from each condition are shown. (E) Quantitation of percent of cells gated within each individual region. Data from n = 3 per condition are shown as means ± SEM. (*) P < 0.05; (**) P < 0.01. (F) Real-time RT–PCR analysis of ywhaz expression from in vitro differntiation assays represented in D. Reactions were peformed on cDNA reverse-transcribed from RNA harvested from whole-cell suspensions (GFP− and GFP+ cells). (G) Schematic representation of the role of miR-451 as a regulator of 14-3-3ζ, erythroid differentiation, and the response of erythrocytes to stress.
References
-
- Aitken A 2006. 14-3-3 proteins: A historic overview. Semin Cancer Biol 16: 162–172 - PubMed
-
- Ambros V 2001. MicroRNAs: Tiny regulators with great potential. Cell 107: 823–826 - PubMed
-
- Barry EF, Felquer FA, Powell JA, Biggs L, Stomski FC, Urbani A, Ramshaw H, Hoffmann P, Wilce MC, Grimbaldeston MA, et al. 2009. 14-3-3:Shc scaffolds integrate phosphoserine and phosphotyrosine signaling to regulate phosphatidylinositol 3-kinase activation and cell survival. J Biol Chem 284: 12080–12090 - PMC - PubMed
-
- Bruchova-Votavova H, Yoon D, Prchal JT 2010. miR-451 enhances erythroid differentiation in K562 cells. Leuk Lymphoma 51: 686–693 - PubMed
Publication types
MeSH terms
Substances
Grants and funding
LinkOut - more resources
Full Text Sources
Other Literature Sources
Molecular Biology Databases