. 2010 Aug 30;207(9):1871-8.
doi: 10.1084/jem.20100209. Epub 2010 Aug 2.

IL-2 reverses established type 1 diabetes in NOD mice by a local effect on pancreatic regulatory T cells

Affiliations

IL-2 reverses established type 1 diabetes in NOD mice by a local effect on pancreatic regulatory T cells

Yenkel Grinberg-Bleyer et al. J Exp Med. .

Abstract

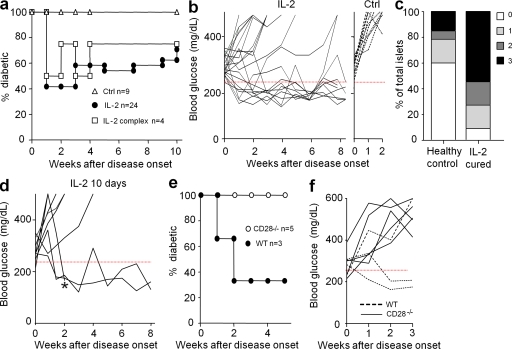
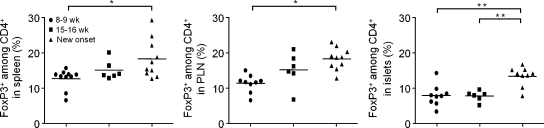
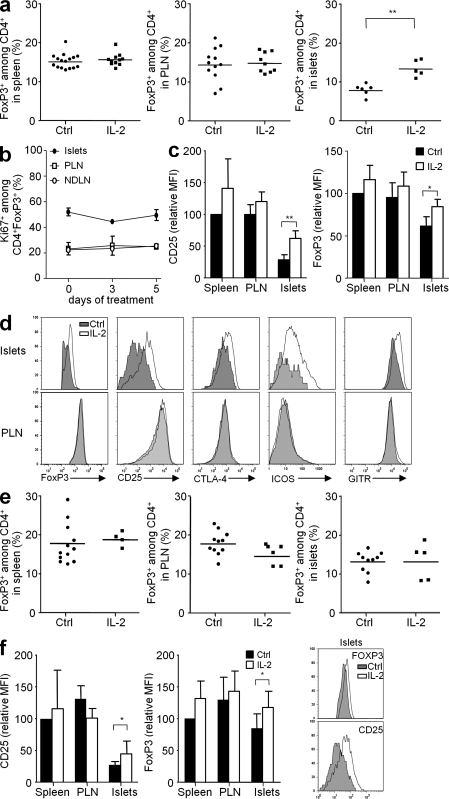
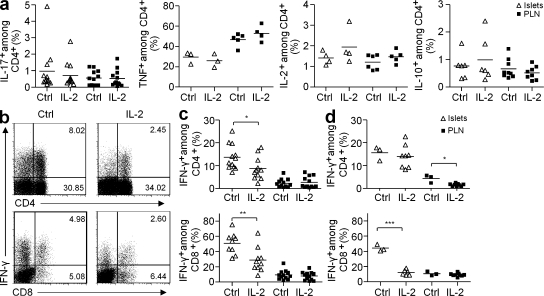
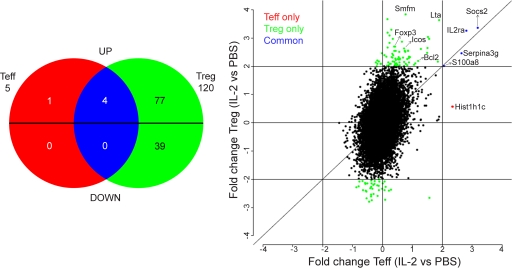
Regulatory T cells (T reg cells) play a major role in controlling the pathogenic autoimmune process in type 1 diabetes (T1D). Interleukin 2 (IL-2), a cytokine which promotes T reg cell survival and function, may thus have therapeutic efficacy in T1D. We show that 5 d of low-dose IL-2 administration starting at the time of T1D onset can reverse established disease in NOD (nonobese diabetic) mice, with long-lasting effects. Low-dose IL-2 increases the number of T reg cells in the pancreas and induces expression of T reg cell-associated proteins including Foxp3, CD25, CTLA-4, ICOS (inducible T cell costimulator), and GITR (glucocorticoid-induced TNF receptor) in these cells. Treatment also suppresses interferon gamma production by pancreas-infiltrating T cells. Transcriptome analyses show that low-dose IL-2 exerts much greater influence on gene expression of T reg cells than effector T cells (T eff cells), suggesting that nonspecific activation of pathogenic T eff cells is less likely. We provide the first preclinical data showing that low-dose IL-2 can reverse established T1D, suggesting that this treatment merits evaluation in patients with T1D.


Figures

Figure 1.
Figure 1.
Diabetes remission by IL-2 therapy. (a and b) Spontaneous new-onset diabetic NOD mice (two consecutive blood glucose concentrations between 250 and 350 mg/dl) were treated for 5 d with PBS or denatured IL-2 (Ctrl), 25,000 IU IL-2 (IL-2), or 0.5 µg IL-2 + 5 µg anti–IL-2 (IL-2 complex). Blood glucose concentrations were monitored. (a) Percentage of diabetic mice. (b) Blood glucose concentrations in IL-2–treated (left) or control (right) mice. The 250 mg/dl blood glucose value is indicated by a dashed red line. Age at treatment onset was 26 ± 9.4 wk in mice that did not revert and 24 ± 7.6 wk in the cured ones. (c) Intraislet infiltration in IL-2–treated mice that remain free of overt diabetes 12–35 wk after treatment (IL-2 cured) and diabetes-free age-matched controls (healthy controls) was evaluated histologically. The graph shows the percentage of islets with no infiltration (0), peri-insulitis (1), moderate insulitis with <50% islet area infiltrated (2), and severe insulitis with >50% islet area infiltrated (3). Data for the control group represent 60 islets from four mice, and for the IL-2–treated group represent 22 islets from three mice. (d) Blood glucose concentrations in new onset diabetic mice that had not reverted after 5 d of IL-2 treatment and were further treated for 5 more days. Age at treatment onset was 22 ± 4.5 wk in mice that did not revert and 22 ± 9.2 in the cured ones. * indicates a mouse that was sacrificed for analysis. (e and f) New onset diabetic CD28−/− or WT littermate NOD mice were treated for 5 d with 25,000 IU IL-2 and blood glucose concentrations were monitored. (e) Percentage of diabetic mice. (f) Blood glucose concentrations.
Figure 2.
Figure 2.
The proportion of T reg cells increases with age and disease in lymphoid tissues and in the pancreas of NOD mice. The percentage of Foxp3+ cells among CD4+ cells in the spleen, PLN, and pancreas of untreated nondiabetic NOD mice of different ages and recent onset diabetic NOD mice (new onset) was quantified by FACS. Graphs show cumulative individual and mean (horizontal bars) data from two to five independent experiments. Each symbol represents an individual mouse. *, P < 0.05; **, P < 0.001. The percentage of T reg cells in the pancreas at 8–9 wk is significantly different from the percentage of T reg cells in the PLN (P < 0.05) and spleen (P < 0.05) of mice of the same age. The percentage of T reg cells in the pancreas at 15–16 wk is significantly different from the percentage of T reg cells in the PLN (P < 0.01) and spleen (P < 0.001) of mice of the same age.
Figure 3.
Figure 3.
IL-2 treatment increases T reg cell proportions and reinforces the T reg cell phenotype specifically in inflamed pancreas. Prediabetic (a, c, and d) or new onset diabetic (e and f) NOD mice received five daily injections of PBS (Ctrl) or 25,000 IU IL-2 and were sacrificed 2 h after the last injection. (a and e) The percentage of Foxp3+ cells among CD4+ cells was determined by FACS in the spleen, PLN, and pancreas. Symbols represent individual mice and horizontal bars are the means. (b) Percentage of Ki67+ cells among CD4+Foxp3+ cells from islets, PLN, and nondraining LN (NDLN) of prediabetic mice untreated (day 0) or treated with daily injections of 25,000 IU IL-2 for 3 or 5 d (days 3 and 5). n = 2–5 mice per group. The graph is representative of three independent experiments. (c and f) Mean fluorescence intensity (MFI) of CD25 and Foxp3 expression among CD4+Foxp3+ cells infiltrating the spleen, PLN, and pancreas, expressed as relative percentage from the mean fluorescence intensity value in the spleen, which has an arbitrary value of 100%. Graphs show cumulative mean data ± SEM from control mice (black) and mice treated with IL-2 for 5 d (white), from four to six independent experiments. *, P < 0.05; **, P < 0.001. A representative histogram of CD25 and Foxp3 intensities on CD4+ gated islet cells is shown for new onset diabetic animals (f, right). (d) Expression of the indicated molecules by CD4+Foxp3+ cells from mice treated with PBS (gray) or IL-2 (white) for 5 d. Graphs are representative of two to six independent experiments.
Figure 4.
Figure 4.
IL-2 treatment induces a decrease in IFN-γ production by pancreas-infiltrating T cells. Cytokine production by CD4+ and CD8+ T cells from pancreas and PLN of NOD mice, treated as in Fig. 3, was quantified after ex vivo restimulation with PMA-ionomycin. (a) Percentage of CD4+ producing IL-10, IL-2, TNF, or IL-17 in control or IL-2–treated prediabetic NOD mice. Data cumulate two to three independent experiments. (b) Representative dot plot of IFN-γ production in CD4+ (top) and CD8+ (bottom) T cells in the pancreas of prediabetic mice treated or not with IL-2. Numbers in quadrants indicate percentage of cells. (c and d) Percentage of IFN-γ+ CD4+ (top) and CD8+ (bottom) T cells in islets and PLN of prediabetic (c) and new-onset diabetic (d) NOD mice. Data cumulate five and three experiments, respectively. Symbols represent individual mice and horizontal bars are the means. *, P < 0.05; **, P < 0.001; ***, P < 0.0001.
Figure 5.
Figure 5.
In vivo IL-2 treatment selectively modifies the T reg cell transcriptome. Gene array analysis was performed on FACS-sorted T eff cells and T reg cells from spleen and LN of Foxp3-GFP NOD mice treated with PBS or IL-2, as in Fig. 3. (Left) Venn diagram comparing the two gene lists (T eff cell–IL-2 vs. T eff cell–PBS and T reg cell–IL-2 vs. T reg cell–PBS) filtered at twofold changes and with overlapping probes discarded. Probes are separated in up- or down-regulation by IL-2 from reference PBS. Genes modified by IL-2 only in T eff cells are in red, only in T reg cells are in green, and in both subsets are in blue. Each number represents the number of genes in each subgroup. (Right) Fc/Fc plot comparison of fold change expression values of IL-2 effect on T reg cells versus T eff cells for probes, with detection p-values <0.05. Only significant probes with fold change ≥2 are colored. Data are from one experiment with biological duplicates for each condition.

References

    1. Ablamunits V., Elias D., Reshef T., Cohen I.R. 1998. Islet T cells secreting IFN-gamma in NOD mouse diabetes: arrest by p277 peptide treatment. J. Autoimmun. 11:73–81 10.1006/jaut.1997.0177 - DOI - PubMed
    1. Ahmadzadeh M., Rosenberg S.A. 2006. IL-2 administration increases CD4+ CD25(hi) Foxp3+ regulatory T cells in cancer patients. Blood. 107:2409–2414 10.1182/blood-2005-06-2399 - DOI - PMC - PubMed
    1. Baekkeskov S., Kanatsuna T., Klareskog L., Nielsen D.A., Peterson P.A., Rubenstein A.H., Steiner D.F., Lernmark A. 1981. Expression of major histocompatibility antigens on pancreatic islet cells. Proc. Natl. Acad. Sci. USA. 78:6456–6460 10.1073/pnas.78.10.6456 - DOI - PMC - PubMed
    1. Battaglia M., Stabilini A., Roncarolo M.G. 2005. Rapamycin selectively expands CD4+CD25+FoxP3+ regulatory T cells. Blood. 105:4743–4748 10.1182/blood-2004-10-3932 - DOI - PubMed
    1. Cassan C., Piaggio E., Zappulla J.P., Mars L.T., Couturier N., Bucciarelli F., Desbois S., Bauer J., Gonzalez-Dunia D., Liblau R.S. 2006. Pertussis toxin reduces the number of splenic Foxp3+ regulatory T cells. J. Immunol. 177:1552–1560 - PubMed

Publication types

MeSH terms