. 2010 Oct;30(19):4616-25.
doi: 10.1128/MCB.00585-10. Epub 2010 Aug 2.

Requirement of JIP1-mediated c-Jun N-terminal kinase activation for obesity-induced insulin resistance

Affiliations

Requirement of JIP1-mediated c-Jun N-terminal kinase activation for obesity-induced insulin resistance

Caroline Morel et al. Mol Cell Biol. 2010 Oct.

Abstract

The c-Jun NH(2)-terminal kinase (JNK) interacting protein 1 (JIP1) has been proposed to act as a scaffold protein that mediates JNK activation. However, recent studies have implicated JIP1 in multiple biochemical processes. Physiological roles of JIP1 that are related to the JNK scaffold function of JIP1 are therefore unclear. To test the role of JIP1 in JNK activation, we created mice with a germ line point mutation in the Jip1 gene (Thr(103) replaced with Ala) that selectively blocks JIP1-mediated JNK activation. These mutant mice exhibit a severe defect in JNK activation caused by feeding of a high-fat diet. The loss of JIP1-mediated JNK activation protected the mutant mice against obesity-induced insulin resistance. We conclude that JIP1-mediated JNK activation plays a critical role in metabolic stress regulation of the JNK signaling pathway.


Figures
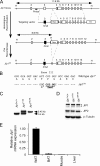
FIG. 1.
FIG. 1.
Creation of mice with a germ line knock-in mutation in the Jip1 gene. (A) Schematic illustration of the gene targeting strategy. A floxed NeoR cassette was inserted into intron 3 of the Jip1 gene by homologous recombination. Point mutations were introduced into exon 3. The NeoR cassette was excised using Cre recombinase. HindIII restriction sites are indicated (H). (B) The DNA sequence of the region of exon 3 of the Jip1 gene that surrounds codon 103 is presented. The mutated allele replaces codon 103, which encodes Thr (ACT) with Ala (GCC). Translationally silent mutations were also introduced to create an XmaI restriction site in the mutated Jip1 allele (Jip1TA). (C) Genomic DNA was prepared from wild-type (Jip1+/+) mice, heterozygous (Jip1+/TA), and homozygous (Jip1TA/TA) mice. Genotype analysis was performed by PCR. (D) Extracts prepared from the cerebellum of Jip1+/+, Jip1+/TA, and Jip1TA/TA mice were examined by immunoblot analysis by probing with antibodies to JIP1, JIP2, and β-tubulin. (E) The expression of Jip1 mRNA in white adipose tissue (WAT), brown adipose tissue (BAT), quadriceps muscle, and liver of C57BL/6J mice was measured by quantitative RT-PCR analysis of mRNA. The relative mRNA expression was calculated by normalization of the data to the amount of Gapdh mRNA in each sample (mean ± SE; n = 8).
FIG. 2.
FIG. 2.
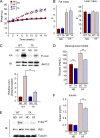
Comparison of HFD-induced obesity in JIPWT and JIPTA mice. (A) Mice (8 to 10 weeks old) were fed either a chow diet (ND) or a high-fat diet (HFD) for 16 weeks. The body weight of the mice was measured (mean ± SE; n = 10 to 15). No significant difference between the weights of JIPWT and JIPTA mice was detected (P > 0.05). (B) Fat and lean body mass of mice fed (3 weeks) a chow diet (ND) or an HFD (HF) was measured by 1H-MRS. The data presented are the means ± SE (n = 8). No significant difference between JIPWT and JIPTA mice was detected (P > 0.05). (C) Chow-fed (ND) and HFD-fed (HF) mice (16 weeks) were fasted overnight. JNK1 activity in epididymal fat was measured in a protein kinase (KA) assay using c-Jun and [γ-32P]ATP as substrates. The cell extracts used for the protein kinase assay were also examined by immunoblot analysis by probing with an antibody to JNK. Representative data are presented (upper panel) and quantitated (mean ± SE [n = 5]) (lower panel). Statistically significant differences are indicated (**, P < 0.01). (D) Chow-fed (ND) and HFD-fed (HF) mice (16 weeks) were fasted overnight. The blood glucose concentration was measured (mean ± SE; n = 10 to 15). Statistically significant differences are indicated (**, P < 0.01). (E) Chow-fed (ND) and HFD-fed (HF) mice (16 weeks) were fasted overnight. Epididymal fat was examined by immunoblot analysis by probing with antibodies to phospho-Ser307 IRS1, IRS1, and tubulin. (F) Chow-fed (ND) and HFD-fed (HF) mice (16 weeks) were fasted overnight. The blood insulin concentration was measured (mean ± SE; n = 10 to 15). Statistically significant differences are indicated (*, P < 0.05).
FIG. 3.
FIG. 3.
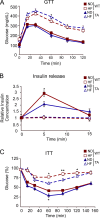
Comparison of the responses of JIPWT and JIPTA mice to glucose and insulin tolerance tests. (A) Glucose tolerance tests (GTT) with chow-fed (ND) and HFD-fed JIPWT and JIPTA mice (16 weeks) were performed by measurement of blood glucose concentrations in animals following intraperitoneal injection of glucose (1 g/kg). The data presented represent the means ± SE (n = 10 to 15). No statistically significant differences between JIPWT and JIPTA mice were detected (P > 0.05). (B) Glucose-induced insulin release. The effect of administration of glucose (2 g/kg body mass) by intraperitoneal injection on the blood insulin concentration was examined (means ± SE; n = 13 to 15). Statistically significant differences between JIPWT and JIPTTA mice are indicated (*, P < 0.05). (C) Insulin tolerance tests (ITT) with JIPWT and JIPTA mice fed either a chow diet (ND) or an HFD for 16 weeks were performed by intraperitoneal injection of insulin (1.5 U/kg body mass). The concentration of blood glucose was measured (mean ± SE; n = 10). Statistically significant differences between JIPWT and JIPTTA mice are indicated (*, P < 0.05; **, P < 0.01).
FIG. 4.
FIG. 4.
Effect of the Thr103Ala JIP1 mutation on insulin sensitivity. Insulin sensitivity was measured using a hyperinsulinemic-euglycemic clamp in conscious chow-fed (ND) and HFD-fed (HF) JIP1WT and JIP1TA mice. The data presented are the means ± SE for 8 or 9 experiments. Statistically significant differences between JIP1WT and JIP1TA mice are indicated (*, P < 0.05). (A) Steady-state glucose infusion rate during the clamp. (B) Hepatic glucose production (HGP) during the clamp. (C) Hepatic insulin action, expressed as insulin-mediated percent suppression of basal HGP. (D) Insulin-stimulated whole-body glucose turnover. (E) Whole-body glycogen plus lipid synthesis. (F) Whole-body glycolysis.
FIG. 5.
FIG. 5.
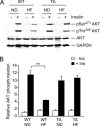
Increased insulin sensitivity of HFD-fed JIP1TA mice compared with that of HFD-fed JIP1TA mice. (A) Chow-fed (ND) and HFD-fed (HF) JIP1WT and JIP1TA mice (16 weeks) were fasted overnight and then treated by intraperitoneal injection of 1.5 U/kg insulin. Extracts prepared from epididymal fat pads at 10 min postinjection were examined by immunoblot analysis using antibodies to phospho-AKT (Thr308 and Ser473), AKT, and GAPDH. (B) Quantitative analysis of AKT phosphorylation (Ser473) was performed by ELISA (Luminex 200 machine). The relative AKT phosphorylation is presented (mean ± SE; n = 5 to 8). Ins, insulin.
FIG. 6.
FIG. 6.
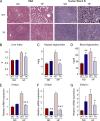
The Thr103Ala JIP1 mutation reduces HFD-induced hepatic steatosis. (A) Sections prepared from chow-fed (ND) and HFD-fed (HF) JIP1WT and JIP1TA mice (16 weeks) were stained with hematoxylin and eosin (H&E) or with Sudan Black B. Scale bar = 100 μm. (B) The liver mass at the time of necropsy (16 weeks) is presented (mean ± SE; n = 10). Statistically significant differences between JIP1WT and JIP1TA mice are indicated (*, P < 0.05). (C and D) The amount of hepatic or blood triglycerides was measured (mean ± SE; n = 10). Statistically significant differences between JIP1WT and JIP1TA mice are indicated (*, P < 0.05; **, P < 0.01). (E to G) The amount of C/ebpα, C/ebpβ, or Srebp1c mRNA in the liver of JIP1WT and JIP1TA mice was measured by quantitative RT-PCR and was normalized to the amount of Gapdh mRNA in each sample (mean ± SE; n = 8). Statistically significant differences between JIP1WT and JIP1TA mice are indicated (*, P < 0.05; **, P < 0.01; ***, P < 0.001)).
FIG. 7.
FIG. 7.
Comparison of energy balance of JIPWT and JIPTA mice using metabolic cages. (A to G) Groups of 6 mice were examined during a 3-day period to measure the mean food and water consumption, gas exchange (VO2 and VCO2), respiratory exchange quotient [VCO2]/[VO2], energy expenditure, and physical activity. Statistically significant differences between JIPWT and JIPTA mice are indicated (*, P < 0.05; **, P < 0.01).
FIG. 8.
FIG. 8.
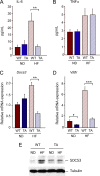
Downregulation of the hepatic IL-6 pathway in JIP1TA mice. (A and B) Chow-fed (ND) and HFD-fed (HF) JIP1WT and JIP1TA mice (16 weeks) were fasted overnight. The amounts of IL-6 and TNF-α in the blood of chow-fed and HFD-fed JIPWT and JIPTTA mice were examined by ELISA (mean ± SE; n = 10). Statistically significant differences between JIPWT and JIPTTA mice are indicated (**, P < 0.01). (C and D) The expression of Socs3 and Vldlr mRNA in the liver was measured by quantitative RT-PCR analysis of mRNA. The relative mRNA expression was calculated by normalization of the data to the amount of Gapdh RNA in each sample (mean ± SE; n = 8). Statistically significant differences between JIPWT and JIPTTA mice are indicated (**, P < 0.01; ***, P < 0.001). (E) The expression of SOCS3 and α-tubulin in the livers of chow-fed and HFD-fed JIPWT and JIPTTA mice was measured by immunoblot analysis.
FIG. 9.
FIG. 9.
Adipokines in JIP1WT and JIP1TA mice. (A and B) The blood concentration of leptin or resistin from chow-fed (ND) or HFD-fed (HF) JIP1WT and JIP1TA mice (16 weeks.) was measured by ELISA (mean ± SE; n = 10). (C) The amount of adiponectin mRNA in epididymal fat was measured by quantitative RT-PCR and was normalized to the amount of Gapdh mRNA in each sample (mean ± SE; n = 8). Statistically significant differences between JIP1WT and JIP1TA mice are indicated (*, P < 0.05; **, P < 0.01).

Similar articles

Cited by

References

    1. Belgardt, B. F., J. Mauer, F. T. Wunderlich, M. B. Ernst, M. Pal, G. Spohn, H. S. Bronneke, S. Brodesser, B. Hampel, A. C. Schauss, and J. C. Bruning. 2010. Hypothalamic and pituitary c-Jun N-terminal kinase 1 signaling coordinately regulates glucose metabolism. Proc. Natl. Acad. Sci. U. S. A. 107:6028-6033. - PMC - PubMed
    1. Buchsbaum, R. J., B. A. Connolly, and L. A. Feig. 2002. Interaction of Rac exchange factors Tiam1 and Ras-GRF1 with a scaffold for the p38 mitogen-activated protein kinase cascade. Mol. Cell. Biol. 22:4073-4085. - PMC - PubMed
    1. Copps, K. D., N. J. Hancer, L. Opare-Ado, W. Qiu, C. Walsh, and M. F. White. 2010. Irs1 serine 307 promotes insulin sensitivity in mice. Cell Metab. 11:84-92. - PMC - PubMed
    1. Dajas-Bailador, F., E. V. Jones, and A. J. Whitmarsh. 2008. The JIP1 scaffold protein regulates axonal development in cortical neurons. Curr. Biol. 18:221-226. - PMC - PubMed
    1. Emanuelli, B., P. Peraldi, C. Filloux, C. Chavey, K. Freidinger, D. J. Hilton, G. S. Hotamisligil, and E. Van Obberghen. 2001. SOCS-3 inhibits insulin signaling and is up-regulated in response to tumor necrosis factor-alpha in the adipose tissue of obese mice. J. Biol. Chem. 276:47944-47949. - PubMed

Publication types

MeSH terms