. 2010 Nov 18;116(20):4251-61.
doi: 10.1182/blood-2010-01-262071. Epub 2010 Aug 2.

Recurrent expression signatures of cytokines and chemokines are present and are independently prognostic in acute myelogenous leukemia and myelodysplasia

Affiliations

Recurrent expression signatures of cytokines and chemokines are present and are independently prognostic in acute myelogenous leukemia and myelodysplasia

Steven M Kornblau et al. Blood. .

Abstract

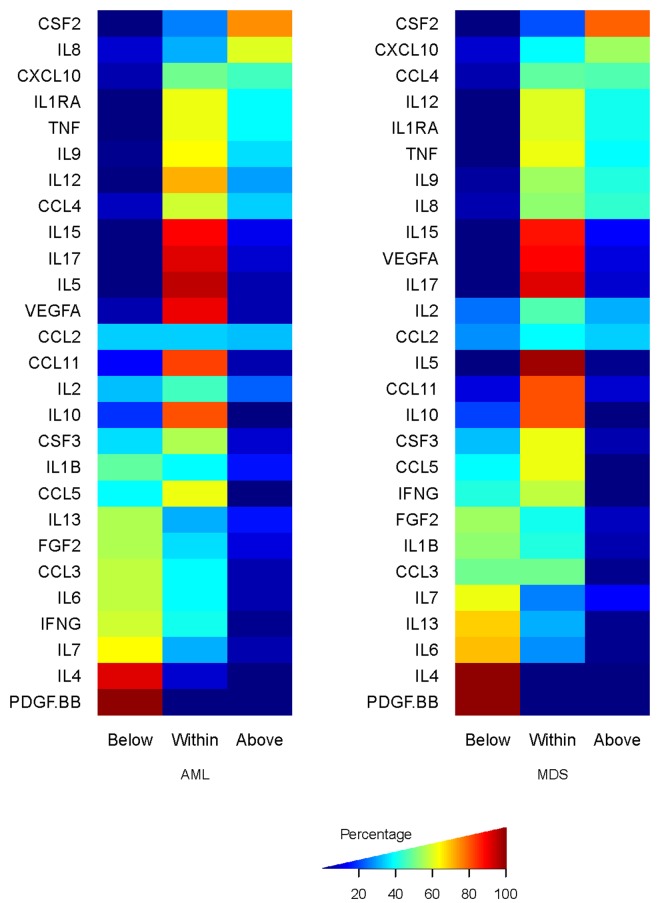
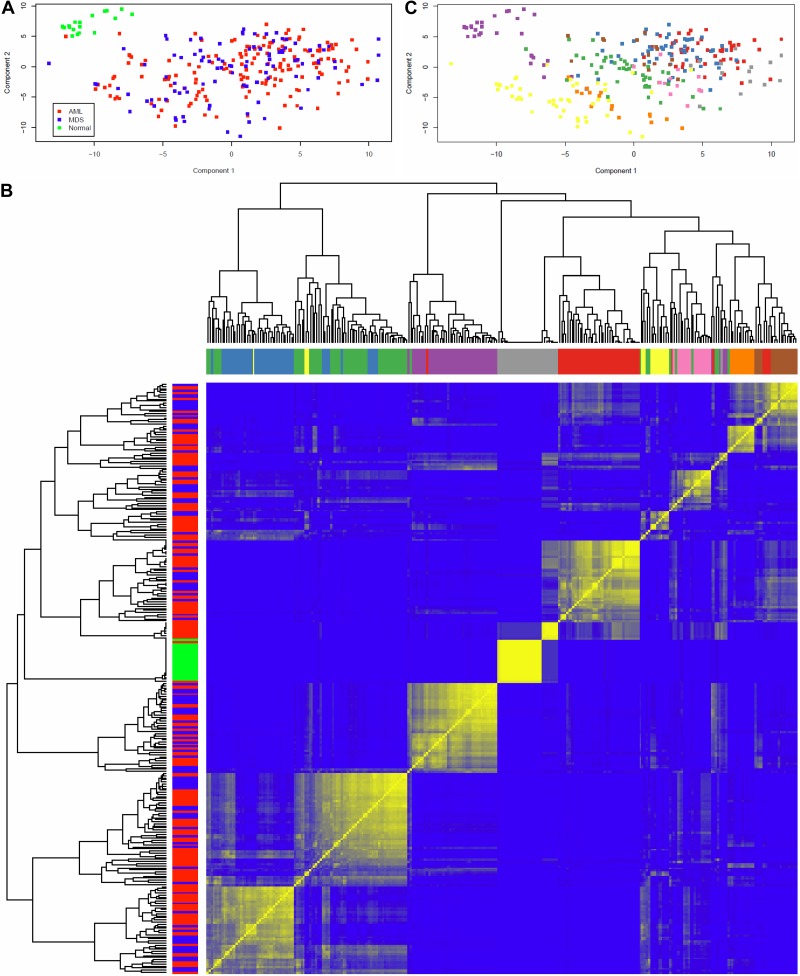
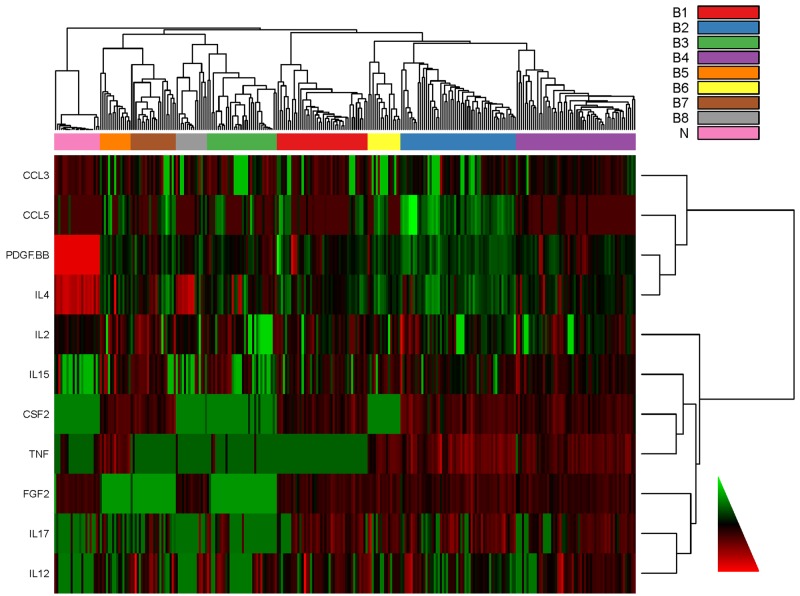
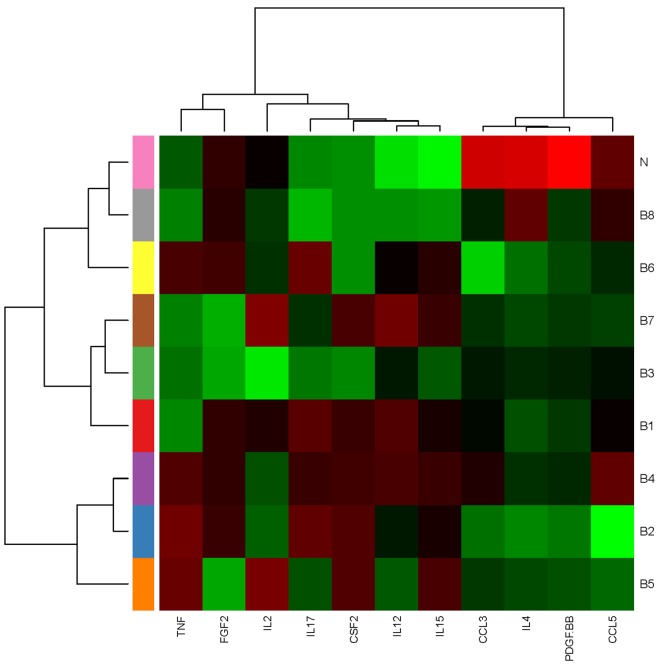
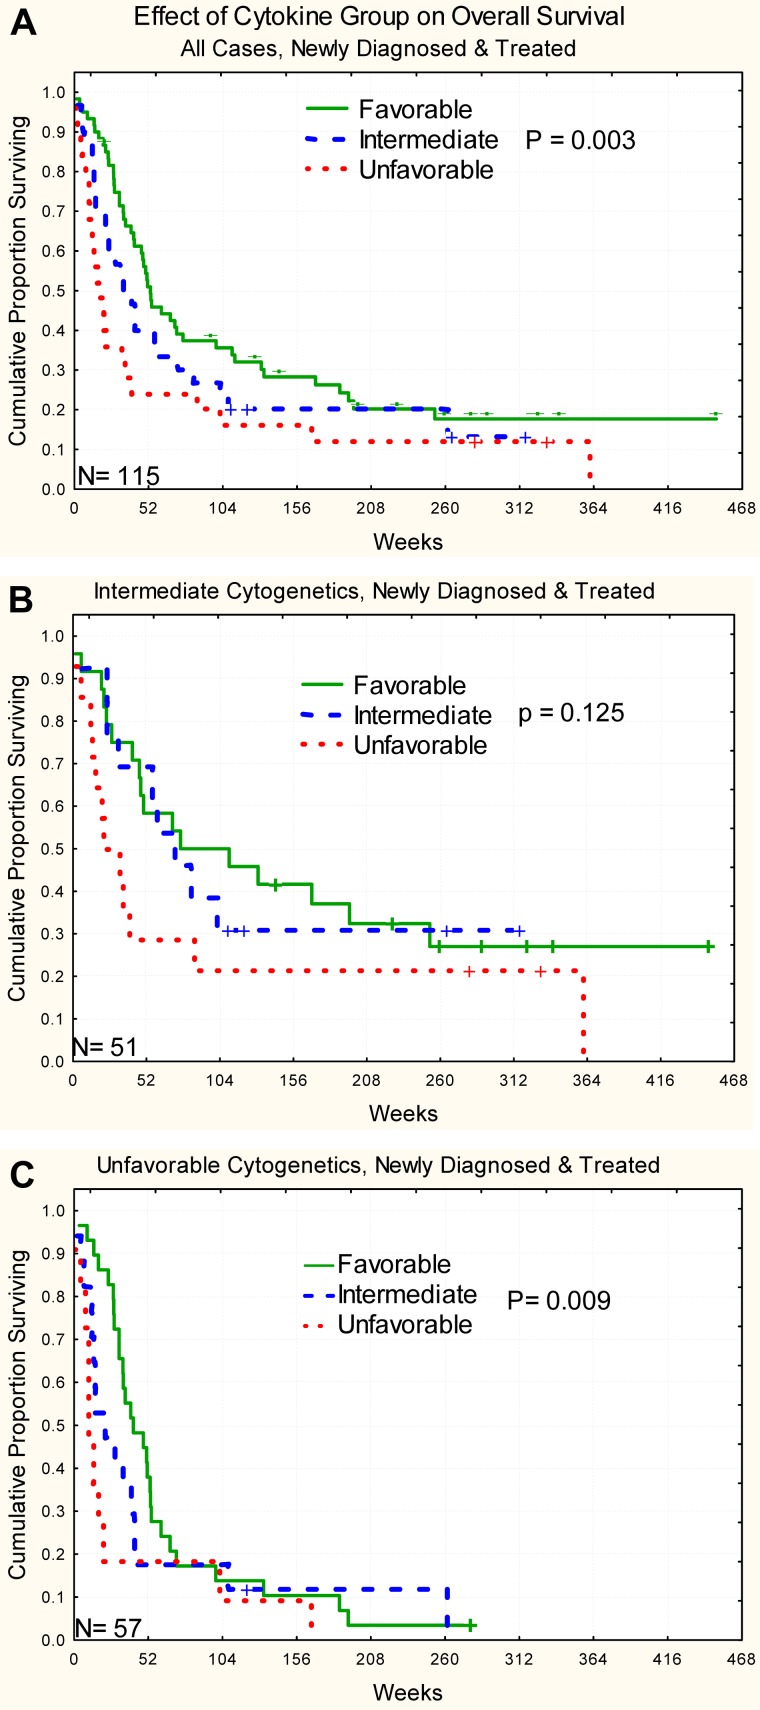
The role of circulating cytokines and chemokines (C&Ckine) in activating signal transduction in leukemic cells is incompletely defined. We hypothesized that comprehensive profiling of C&Ckine expression in leukemia would provide greater insight compared with individual analyses. We used multiplex array technology to simultaneously measure the level of 27 C&Ckines in serum from 176 acute myelogenous leukemia (AML) and 114 myelodysplastic syndrome (MDS) patients and 19 normal controls. C&Ckine levels in AML and MDS differed significantly from normal controls (5 higher, 13 lower) but were similar to each other for 24 of 27 analytes, with interleukin-8 and interleukin-13 higher in AML and vascular endothelial growth factor A higher in MDS. Levels did not correlate with age, gender, infection, or blood counts; however, 3 correlated with specific cytognetic abnormalities in AML. Individually, few cytokines had any correlation with response or survival. In newly diagnosed AML, 8 C&Ckine signatures, distinct from the normal control signature, were observed. These signatures had prognostic impact, affecting remission, primary resistance, relapse rates, and overall survival, individually (P = .003) and in multivariable analysis (P = .004). These patterns suggest specific therapeutic interventions to investigate in subsets of AML patients. In conclusion, C&Ckine expression in AML and MDS differs from normal, is similar with one another, and forms recurrent patterns of expression with prognostic relevance.


Figures

Figure 1
Figure 1
Percentages of AML (left) and MDS (right) samples that are below, within, or above the range of cytokine expression observed in the 19 samples from normal persons.
Figure 2
Figure 2
Principal component analysis and unsupervised hierarchical clustering of C&Ckines. (A) Plot of the first 2 PCs of the C&Ckine data. Normal samples (green) form a separate cluster, but MDS (blue) and AML (red) are indistinguishable. (B) Heatmap showing robustness of clustering in the presence of noise with SD = 1. For each of the 9 sample clusters, each sample clustered with almost all of its neighbors in the assigned cluster more than 50% of the time (and many samples did so > 80% of the time). Based on the silhouette width, more than 90% of samples were correctly clustered. Color bars along the y-axis show diagnosis (green represents normal; red, AML; and blue, MDS) and along the x-axis indicate the 9 highest branches in the dendogram. (C) Clustering of samples based on the dendogram in panel C. Unsupervised hierarchical clustering of C&Ckines based on the Pearson correlation of log intensity across samples using average linkage is shown by the dendogram across the top and left side. Results of a bootstrap cluster test of the reproducibility of hierarchical clustering of cytokines is shown with the color indicating the percentage of times that each pair of samples clustered together, with pure blue = 0% and pure yellow = 100%.
Figure 3
Figure 3
Heatmap of the cytokine data for individual cases. C&Ckine expression for each of the 11 “bimodal” C&Ckines (y-axis) is shown for all cases (x-axis) with the cases sorted into 8 signatures (color boxes along left side x-axis). For display purposes, columns have been standardized to mean of zero and SD = 1. Bimodal cytokines were clustered using Ward linkage and Spearman rank correlation to define distance.
Figure 4
Figure 4
Median expression heatmap for 8 C&Ckine expression signatures. The median expression of each analyte in each signature is shown.
Figure 5
Figure 5
Kaplan-Meier survival curve for overall survival stratified by C&Ckine signature group. (A) All cases. (B) Intermediate cytogenetics. (C) Unfavorable cytogenetics. The number of cases is shown in the lower left corner of each graph.

References

    1. Coussens LM, Werb Z. Inflammation and cancer. Nature. 2002;420(6917):860–867. - PMC - PubMed
    1. Balkwill F, Mantovani A. Inflammation and cancer: back to Virchow? Lancet. 2001;357(9255):539–545. - PubMed
    1. Dranoff G. Cytokines in cancer pathogenesis and cancer therapy. Nat Rev Cancer. 2004;4(1):11–22. - PubMed
    1. Baker SJ, Rane SG, Reddy EP. Hematopoietic cytokine receptor signaling. Oncogene. 2007;26(47):6724–6737. - PubMed
    1. Van Etten RA. Aberrant cytokine signaling in leukemia. Oncogene. 2007;26(47):6738–6749. - PMC - PubMed

MeSH terms