

One-year trajectories of care and resource utilization for recipients of prolonged mechanical ventilation: a cohort study
- PMID: 20679561
- PMCID: PMC2941154
- DOI: 10.7326/0003-4819-153-3-201008030-00007
One-year trajectories of care and resource utilization for recipients of prolonged mechanical ventilation: a cohort study
Abstract
Background: Growing numbers of critically ill patients receive prolonged mechanical ventilation. Little is known about the patterns of care as patients transition from acute care hospitals to postacute care facilities or about the associated resource utilization.
Objective: To describe 1-year trajectories of care and resource utilization for patients receiving prolonged mechanical ventilation.
Design: 1-year prospective cohort study.
Setting: 5 intensive care units at Duke University Medical Center, Durham, North Carolina.
Participants: 126 patients receiving prolonged mechanical ventilation (defined as ventilation for >or=4 days with tracheostomy placement or ventilation for >or=21 days without tracheostomy), as well as their 126 surrogates and 54 intensive care unit physicians, enrolled consecutively over 1 year.
Measurements: Patients and surrogates were interviewed in the hospital, as well as 3 and 12 months after discharge, to determine patient survival, functional status, and facility type and duration of postdischarge care. Physicians were interviewed in the hospital to elicit prognoses. Institutional billing records were used to assign costs for acute care, outpatient care, and interfacility transportation. Medicare claims data were used to assign costs for postacute care.
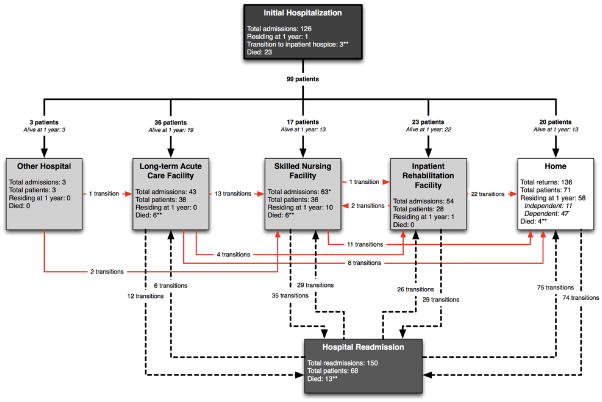
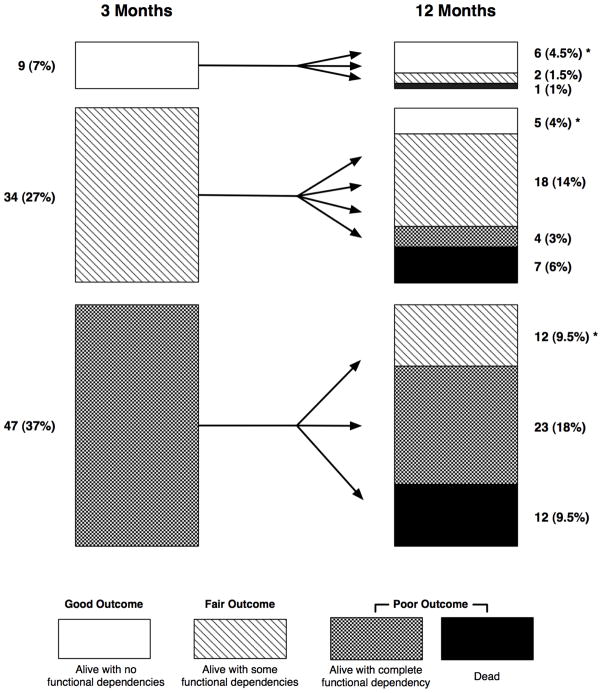
Results: 103 (82%) hospital survivors had 457 separate transitions in postdischarge care location (median, 4 transitions [interquartile range, 3 to 5 transitions]), including 68 patients (67%) who were readmitted at least once. Patients spent an average of 74% (95% CI, 68% to 80%) of all days alive in a hospital or postacute care facility or receiving home health care. At 1 year, 11 patients (9%) had a good outcome (alive with no functional dependency), 33 (26%) had a fair outcome (alive with moderate dependency), and 82 (65%) had a poor outcome (either alive with complete functional dependency [4 patients; 21%] or dead [56 patients; 44%]). Patients with poor outcomes were older, had more comorbid conditions, and were more frequently discharged to a postacute care facility than patients with either fair or good outcomes (P < 0.05 for all). The mean cost per patient was $306,135 (SD, $285,467), and total cohort cost was $38.1 million, for an estimated $3.5 million per independently functioning survivor at 1 year.
Limitation: The results of this single-center study may not be applicable to other centers.
Conclusion: Patients receiving prolonged mechanical ventilation have multiple transitions of care, resulting in substantial health care costs and persistent, profound disability. The optimism of surrogate decision makers should be balanced by discussions of these outcomes when considering a course of prolonged life support.
Primary funding source: None.
Figures
Comment in
-
Summaries for patients: What happens to people who need a breathing machine for more than a few days?Ann Intern Med. 2010 Aug 3;153(3):I56. doi: 10.7326/0003-4819-153-3-201008030-00003. Ann Intern Med. 2010. PMID: 20679556 No abstract available.
References
References for Appendix
-
- Bureau of Labor Statistics. Consumer price index [serial on-line] [9 August 2009]. Accessed at www.bls.gov/cpi/home.htm.
-
- Taira DA, Seto TB, Siegrist R, Cosgrove R, Berezin R, Cohen DJ. Comparison of analytic approaches for the economic evaluation of new technologies alongside multicenter clinical trials. Am Heart J. 2003;145:452–8. - PubMed
-
- Kahn JM, Rubenfeld GD, Rohrbach J, Fuchs BD. Cost savings attributable to reductions in intensive care unit length of stay for mechanically ventilated patients. Med Care. 2008;46:1226–33. - PubMed
-
- Rapoport J, Teres D, Zhao Y, Lemeshow S. Length of stay data as a guide to hospital economic performance for ICU patients. Med Care. 2003;41:386–97. - PubMed
-
- Ellis SG, Miller DP, Brown KJ, Omoigui N, Howell GL, Kutner M, et al. In-hospital cost of percutaneous coronary revascularization. Critical determinants and implications. Circulation. 1995;92:741–7. - PubMed
Publication types
MeSH terms
Grants and funding
LinkOut - more resources
Full Text Sources
Medical