. 2010 Sep;120(9):3377-88.
doi: 10.1172/JCI42113. Epub 2010 Aug 2.

Mice deficient in MCT8 reveal a mechanism regulating thyroid hormone secretion

Affiliations

Mice deficient in MCT8 reveal a mechanism regulating thyroid hormone secretion

Caterina Di Cosmo et al. J Clin Invest. 2010 Sep.

Abstract

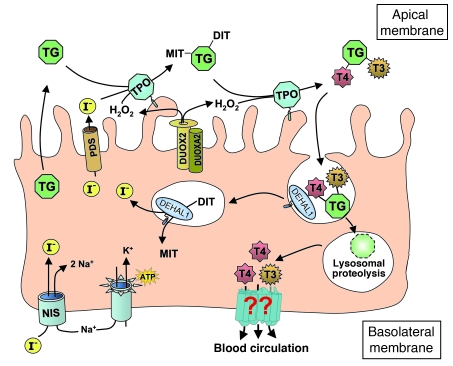
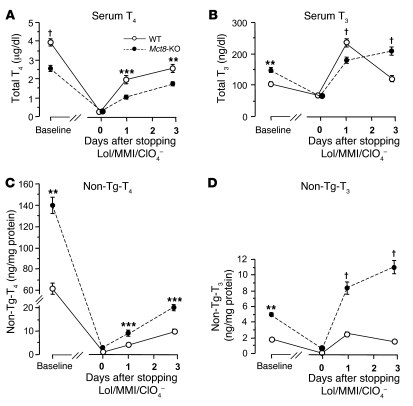
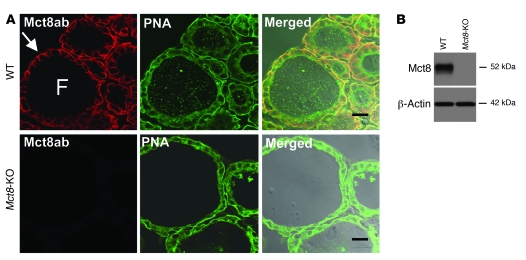
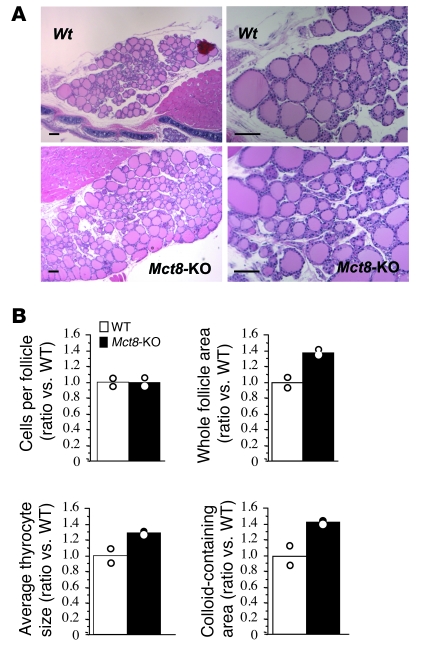
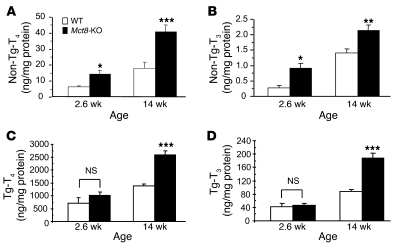
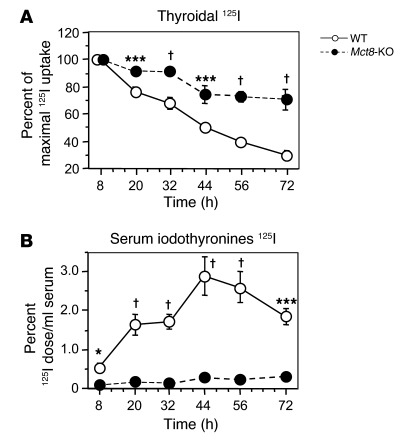
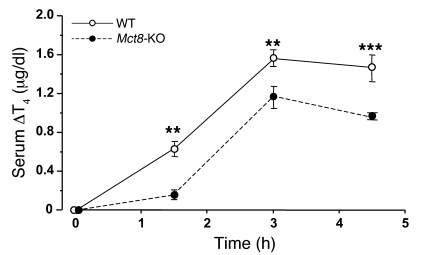
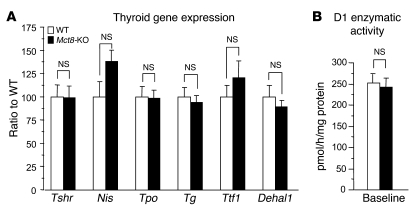
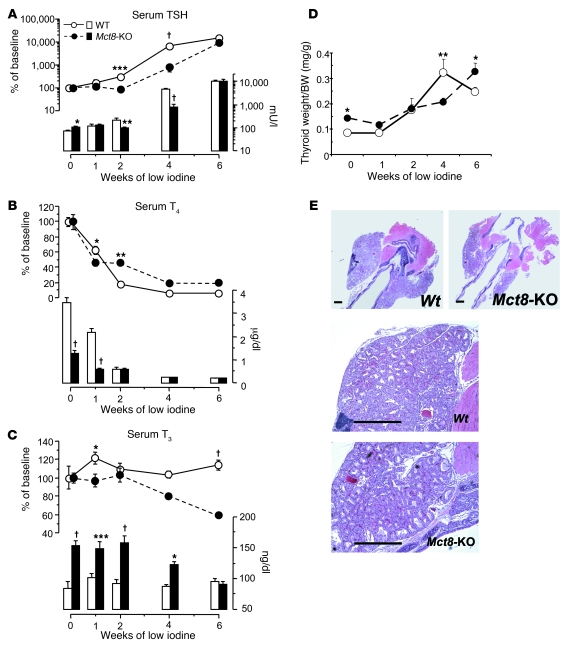
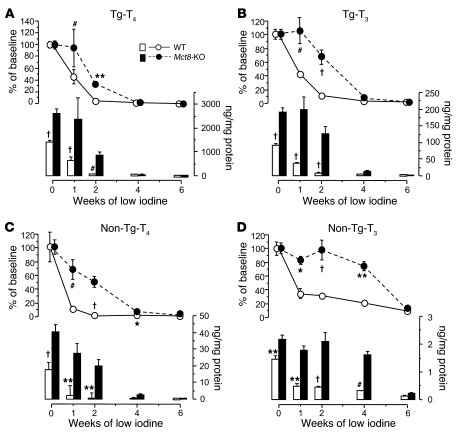
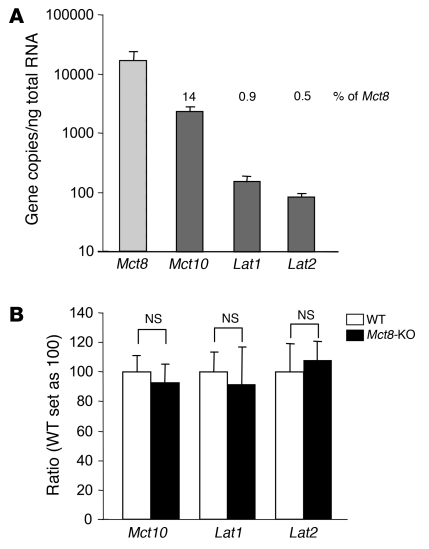
The mechanism of thyroid hormone (TH) secretion from the thyroid gland into blood is unknown. Humans and mice deficient in monocarboxylate transporter 8 (MCT8) have low serum thyroxine (T4) levels that cannot be fully explained by increased deiodination. Here, we have shown that Mct8 is localized at the basolateral membrane of thyrocytes and that the serum TH concentration is reduced in Mct8-KO mice early after being taken off a treatment that almost completely depleted the thyroid gland of TH. Thyroid glands in Mct8-KO mice contained more non-thyroglobulin-associated T4 and triiodothyronine than did those in wild-type mice, independent of deiodination. In addition, depletion of thyroidal TH content was slower during iodine deficiency. After administration of 125I, the rate of both its secretion from the thyroid gland and its appearance in the serum as trichloroacetic acid-precipitable radioactivity was greatly reduced in Mct8-KO mice. Similarly, the secretion of T4 induced by injection of thyrotropin was reduced in Mct8-KO in which endogenous TSH and T4 were suppressed by administration of triiodothyronine. To our knowledge, this study is the first to demonstrate that Mct8 is involved in the secretion of TH from the thyroid gland and contributes, in part, to the low serum T4 level observed in MCT8-deficient patients.


Figures

Figure 1
Figure 1. Diagrammatic representation of the steps involved in TH synthesis.
All have been characterized at the molecular level, except for that involved in TH secretion. The latter, mediated through putative transporters, is indicated by question marks.
Figure 2
Figure 2. The dynamics of rebound of TH synthesis and secretion after chemical suppression was stopped.
Shown are serum total T4 (A) and total T3 (B) concentrations and thyroidal non-Tg-T4 (C) and non-Tg-T3 (D) content (T4 and T3 in the thyroid gland not within the Tg molecule) at baseline and at 0, 1, and 3 days after withdrawal of LoI/MMI/ClO4. Data are expressed as mean ± SEM. At 1 day, serum T4 and T3 levels in Mct8-KO mice were significantly lower as compared with those in WT mice (A and B); in contrast, their thyroid gland content of non-Tg-T4 and Tg-T3 was significantly higher (C and D). The characteristic thyroid function test abnormalities of Mct8-KO mice manifested only on the third day after resumption of the TH synthesis. **P < 0.01, ***P < 0.001, P < 0.0001.
Figure 3
Figure 3. Intrathyroidal expression and localization of the Mct8 protein.
(A) Immunoconfocal images from cryosections of thyroid glands prepared from WT and Mct8-KO mice colabeled with anti-Mct8 antibody (red) and PNA lectin (green). Merged images are shown overlaid on the differential interference contrast image. Mct8 immunolabeling was detected at the basolateral membrane of thyrocytes (arrow) of WT mice, while no labeling was detected in thyroid sections from Mct8-KO mice. PNA lectin labeled the thyrocyte plasma membranes in sections from both WT and Mct8-KO mice. F, follicle. Scale bars: 20 μm. (B) Immunoblot analysis of detergent-soluble protein lysates prepared from thyroid glands of WT and Mct8-KO mice probed with antibodies to Mct8 and to β-actin as a loading control. Samples from WT mice show a band of 52 kDa, corresponding to Mct8. This band was absent in samples from Mct8-KO mice.
Figure 4
Figure 4. Histology of WT and Mct8-KO mouse thyroid glands.
(A) Low- (left) and higher-power (right) views of H&E-stained sections from thyroid glands of 14-week-old WT and Mct8-KO mice. Scale bars: 100 μm. (B) Morphometric analysis of thyroid gland sections showing the number of cells per follicle, whole follicle area, average thyrocyte size, and colloid-containing area (for details, see Methods). The data are expressed relative to WT and presented as mean and variance.
Figure 5
Figure 5. Thyroidal TH content.
Non-Tg-T4 (A) and non-Tg-T3 (B) (T4 and T3 in the thyroid gland not within the Tg molecule), and Tg-T4 (C) and Tg-T3 (D) (T4 and T3 contained within the Tg molecule) of WT and Mct8-KO mice 2.6 and 14 weeks old. Bars represent the mean ± SEM. *P < 0.05, **P < 0.01, ***P < 0.001.
Figure 6
Figure 6. Kinetic TH secretion from the thyroid gland of WT and Mct8-KO mice.
Adult animals were given 125I, and, at indicated time intervals, the radioactivity was determined in their thyroid glands by counting in vivo and in serum samples (see Methods). Results of thyroidal radioactivity are expressed as percent of the maximal 125I uptake, being 100% at 8 hours (A). The results of serum TCA-precipitable radioactivity (iodothyronines 125I) are expressed as percentage of the injected 125I dose per milliliter of serum (B). *P < 0.05, ***P < 0.001, P < 0.0001.
Figure 7
Figure 7. T4 secretion following the administration of TSH.
Mice were pretreated with L-T3 in order to suppress endogenous TSH and T4 prior to the administration of bovine TSH. Serum T4 concentration was measured before and 1.5, 3, and 4.5 hours after injection. The response of T4 was significantly reduced in the Mct8-KO as compared with WT mice at all time points. At time 0 (after L-T3 treatment), serum T4 was 0.36 ± 0.02 and 0.44 ± 0.10 μg/dl in the WT and Mct8-KO mice, respectively (NS). Values are expressed as mean ± SEM of serum T4 increment. **P < 0.01, ***P < 0.001.
Figure 8
Figure 8. Effect of Mct8 deficiency on the expression of genes that regulate thyroid gland activity, hormone synthesis, and metabolism.
(A) The transcript levels of the TSH receptor and genes regulated by TSH and (B) the enzymatic activity of D1 in the thyroid glands of Mct8-KO and WT mice. Values in A are relative to WT. Data are expressed as mean ± SEM.
Figure 9
Figure 9. Effect of low-iodine diet on thyroid function of WT and Mct8-KO mice.
Shown are serum TSH (A), T4 (B), and T3 (C) concentrations. Values are expressed in absolute amount (bars) and as percentage of the mean baseline value of the corresponding genotype (lines). (D) Effect of TSH increase produced by low-iodine diet on thyroid gland weight. Data are expressed as mean ± SEM. (E) Low- (top panels) and higher-power (bottom panels) views of H&E-stained sections from thyroids of WT and Mct8-KO mice after 4 weeks of low-iodine diet. The rise in serum TSH in both genotypes produced typical histological features of hyperplastic goiter (compare sections from untreated mice, Figure 4A). Note the larger glands of WT animals at 4 weeks. Scale bars: 500 μm. *P < 0.05, **P < 0.01, ***P < 0.001, P < 0.0001.
Figure 10
Figure 10. Effect of low-iodine diet on thyroidal TH content of WT and Mct8-KO mice.
Content of Tg-T4 (A) and Tg-T3 (B) (T4 and T3 contained within the Tg molecule) and non-Tg-T4 (C) and non-Tg-T3 (D) (T4 and T3 in the thyroid gland not within the Tg molecule). Values are expressed in absolute amount (bars) and percentage of the mean baseline value of the corresponding genotype (lines). *P < 0.05, **P < 0.01, #P < 0.001, P < 0.0001.
Figure 11
Figure 11. mRNA levels of Mct8 and the other TH transporters in mouse thyroid gland.
(A) Transcript levels of Mct8 and other putative TH transporters were measured in the WT mouse thyroid gland by qPCR. Mct8 was the most abundantly expressed TH transporter. Bars represent the mean ± SEM. The numbers above the bars show the amount of mRNA as percentage of that of Mct8. (B) mRNA levels of Mct10, Lat1, and Lat2 in the thyroid of WT and Mct8-KO mice. Values are expressed as mean ± SEM.

References

    1. Carrasco N. Iodide transport in the thyroid. Biochim Biophys Acta. 1993;1154(1):65–82. - PubMed
    1. Everett LA, et al. Pendred syndrome is caused by mutations in a putative sulphate transport gene (PDS). . Nature Genet. 1997;17(4):411–422. doi: 10.1038/ng1297-411. - DOI - PubMed
    1. Taurog A. Thyroid peroxidase and thyroxine biosynthesis. Recent Prog Horm Res. 1970;26:189–247. - PubMed
    1. De Deken X, et al. Cloning of two human thyroid cDNAs encoding new members of the NADPH oxidase family. J Biol Chem. 2000;275(30):23227–23233. doi: 10.1074/jbc.M000916200. - DOI - PubMed
    1. Friedrichs B, et al. Thyroid functions of mouse cathepsins B, K, and L. J Clin Invest. 2003;111(11):1733–1745. - PMC - PubMed

Publication types

MeSH terms