

Use of self-reported height and weight biases the body mass index-mortality association
- PMID: 20680015
- PMCID: PMC3040787
- DOI: 10.1038/ijo.2010.148
Use of self-reported height and weight biases the body mass index-mortality association
Abstract
Background: Many large-scale epidemiological data sources used to evaluate the body mass index (BMI: kg/m(2)) mortality association have relied on BMI derived from self-reported height and weight. Although measured BMI (BMI(M)) and self-reported BMI (BMI(SR)) correlate highly, self-reports are systematically biased.
Objective: To rigorously examine how self-reporting bias influences the association between BMI and mortality rate.
Subjects: Samples representing the US non-institutionalized civilian population.
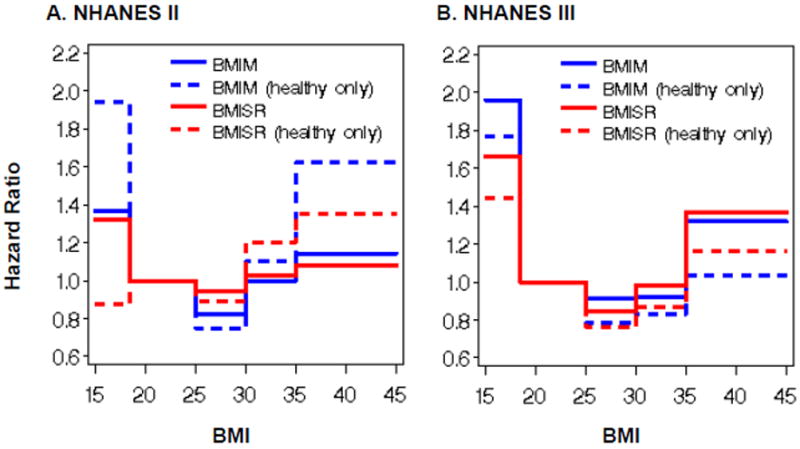
Design and methods: National Health and Nutrition Examination Survey data (NHANES II: 1976-80; NHANES III: 1988-94) contain BMI(M) and BMI(SR). We applied Cox regression to estimate mortality hazard ratios (HRs) for BMI(M) and BMI(SR) categories, respectively, and compared results. We similarly analyzed subgroups of ostensibly healthy never-smokers.
Results: Misclassification by BMI(SR) among the underweight and obesity ranged from 30-40% despite high correlations between BMI(M) and BMI(SR) (r>0.9). The reporting bias was moderately correlated with BMI(M) (r>0.35), but not BMI(SR) (r<0.15). Analyses using BMI(SR) failed to detect six of eight significant mortality HRs detected by BMI(M). Significantly biased HRs were detected in the NHANES II full data set (χ(2)=12.49; P=0.01) and healthy subgroup (χ(2)=9.93; P=0.04), but not in the NHANES III full data set (χ(2)=5.63; P=0.23) or healthy subgroup (χ(2)=1.52; P=0.82).
Conclusions: BMI(SR) should not be treated as interchangeable with BMI(M) in BMI mortality analyses. Bias and inconsistency introduced by using BMI(SR) in place of BMI(M) in BMI mortality estimation and hypothesis tests may account for important discrepancies in published findings.
Conflict of interest statement
Figures
Comment in
-
Self-report corrections for BMI: Comment on Keith et al.Int J Obes (Lond). 2012 Dec;36(12):1591. doi: 10.1038/ijo.2011.277. Epub 2012 Jan 24. Int J Obes (Lond). 2012. PMID: 22270377 Free PMC article. No abstract available.
References
-
- Baskin ML, Ard J, Franklin F, Allison DB. Prevalence of obesity in the United States. Obesity reviews : an official journal of the International Association for the Study of Obesity. 2005;6(1):5–7. - PubMed
-
- Gregg EW, Cheng YJ, Cadwell BL, Imperatore G, Williams DE, Flegal KM, et al. Secular trends in cardiovascular disease risk factors according to body mass index in US adults. JAMA : the journal of the American Medical Association. 2005;293(15):1868–1874. - PubMed
-
- Gregg EW, Cheng YJ, Narayan KM, Thompson TJ, Williamson DF. The relative contributions of different levels of overweight and obesity to the increased prevalence of diabetes in the United States: 1976-2004. Preventive medicine. 2007;45(5):348–352. - PubMed
-
- Calle EE, Thun MJ. Obesity and cancer. Oncogene. 2004;23(38):6365–6378. - PubMed
Publication types
MeSH terms
Grants and funding
LinkOut - more resources
Full Text Sources
Medical
Research Materials
