

Prospects of molecular photoacoustic imaging at 1064 nm wavelength
- PMID: 20680092
- PMCID: PMC3059192
- DOI: 10.1364/OL.35.002663
Prospects of molecular photoacoustic imaging at 1064 nm wavelength
Abstract
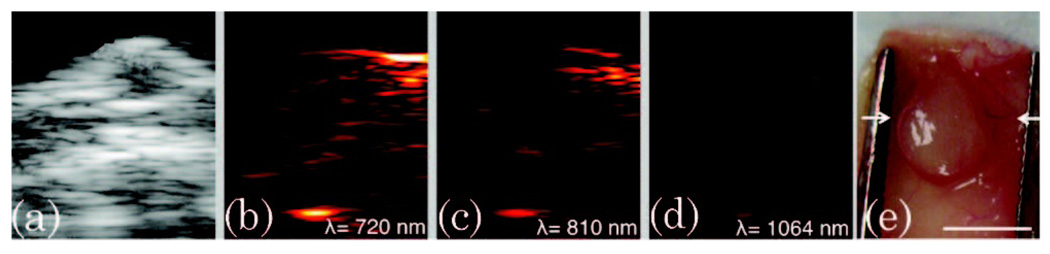
An analysis of the photoacoustic (PA) signal from murine tissue in vivo revealed several benefits of contrast-enhanced PA imaging at a wavelength of 1064nm. Of all the wavelengths tested in a range from 710 to 1064nm, the background PA signal from tissue in vivo was lowest and more homogeneous at 1064nm. For blood-laden tissue, the background PA signal was up to 70% less at 1064nm. Furthermore, when plasmonic nanoparticles, such as silver nanoplates, were introduced in vivo as contrast agents, the contrast in PA images at 1064nm increased 38% compared to 750nm. Therefore, contrast-enhanced PA imaging at 1064nm is advantageous because of the low and homogeneous signal from native tissue, enabling high contrast in PA imaging when exogenous, molecularly targeted agents are employed.
Figures


References
-
- Emelianov SY, Aglyamov SR, Shah J, Sethuraman S, Scott WG, Schmitt R, Motamedi M, Karpiouk A, Oraevsky A. Proc. SPIE. 2004;5320:101.
-
- Mallidi S, Larson T, Aaron J, Sokolov K, Emelianov S. Opt. Express. 2007;15:6583. - PubMed
-
- Eghtedari M, Oraevsky A, Copland J, Kotov N, Conjusteau A, Motamedi M. Nano Lett. 2007;7:1914. - PubMed
-
- Yang X, Skrabalak S, Li Z, Xia Y, Wang L. Nano Lett. 2007;7:3798. - PubMed
-
- Li P, Wei C, Liao C, Chen C, Pao K, Wang C, Wu Y, Shieh D. Proc. SPIE. 2006;6086:60860M.
Publication types
MeSH terms
Substances
Grants and funding
LinkOut - more resources
Full Text Sources
Other Literature Sources
Medical
