

The diagnostic accuracy of US, CT, MRI and 1H-MRS for the evaluation of hepatic steatosis compared with liver biopsy: a meta-analysis
- PMID: 20680289
- PMCID: PMC2995875
- DOI: 10.1007/s00330-010-1905-5
The diagnostic accuracy of US, CT, MRI and 1H-MRS for the evaluation of hepatic steatosis compared with liver biopsy: a meta-analysis
Abstract
Objective: To meta-analyse the diagnostic accuracy of US, CT, MRI and 1H-MRS for the evaluation of hepatic steatosis.
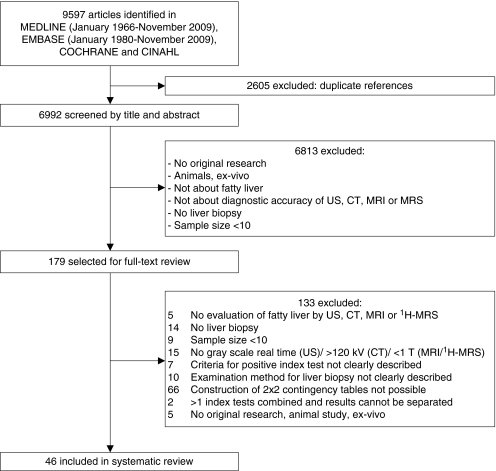
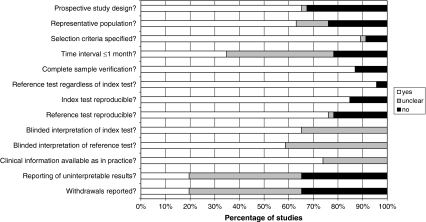
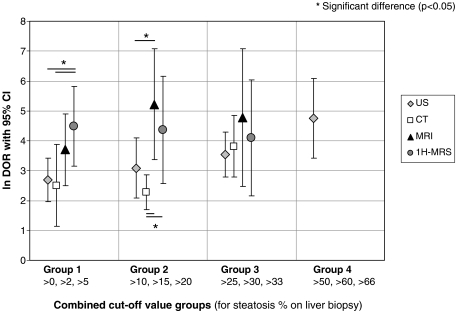
Methods: From a comprehensive literature search in MEDLINE, EMBASE, CINAHL and Cochrane (up to November 2009), articles were selected that investigated the diagnostic performance imaging techniques for evaluating hepatic steatosis with histopathology as the reference standard. Cut-off values for the presence of steatosis on liver biopsy were subdivided into four groups: (1) >0, >2 and >5% steatosis; (2) >10, >15 and >20%; (3) >25, >30 and >33%; (4) >50, >60 and >66%. Per group, summary estimates for sensitivity and specificity were calculated. The natural-logarithm of the diagnostic odds ratio (lnDOR) was used as a single indicator of test performance.
Results: 46 articles were included. Mean sensitivity estimates for subgroups were 73.3-90.5% (US), 46.1-72.0% (CT), 82.0-97.4% (MRI) and 72.7-88.5% (1H-MRS). Mean specificity ranges were 69.6-85.2% (US), 88.1-94.6% (CT), 76.1-95.3% (MRI) and 92.0-95.7% (1H-MRS). Overall performance (lnDOR) of MRI and 1H-MRS was better than that for US and CT for all subgroups, with significant differences in groups 1 and 2.
Conclusion: MRI and 1H-MRS can be considered techniques of choice for accurate evaluation of hepatic steatosis.
Figures
References
Publication types
MeSH terms
LinkOut - more resources
Full Text Sources
Other Literature Sources
Medical
