. 2011 Apr;102(2):197-211.
doi: 10.1007/s11060-010-0314-6. Epub 2010 Jul 31.

hHSS1: a novel secreted factor and suppressor of glioma growth located at chromosome 19q13.33

Affiliations

hHSS1: a novel secreted factor and suppressor of glioma growth located at chromosome 19q13.33

Katiana S Junes-Gill et al. J Neurooncol. 2011 Apr.

Abstract

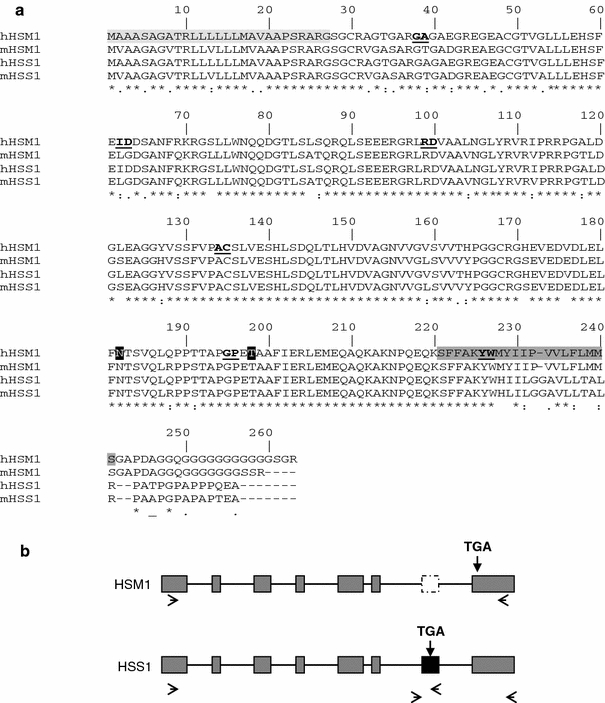
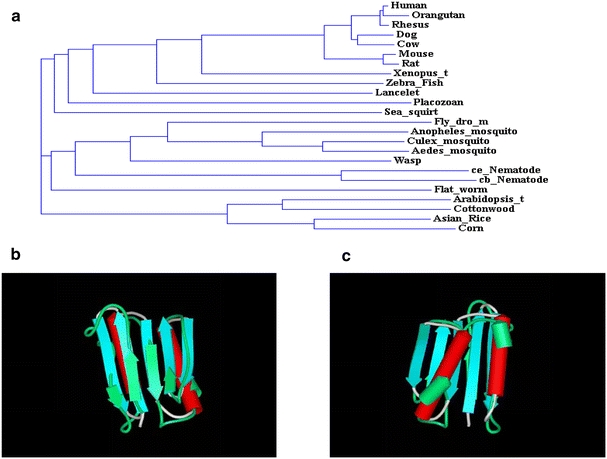
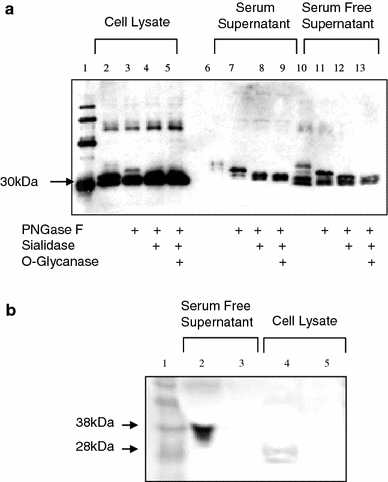
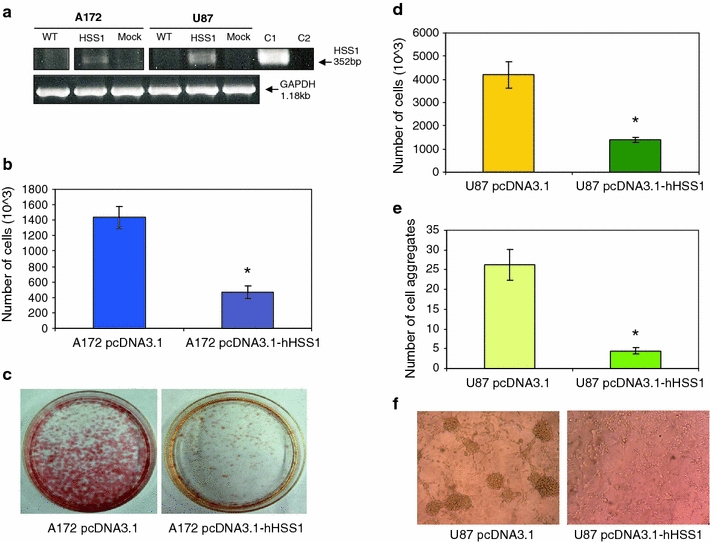
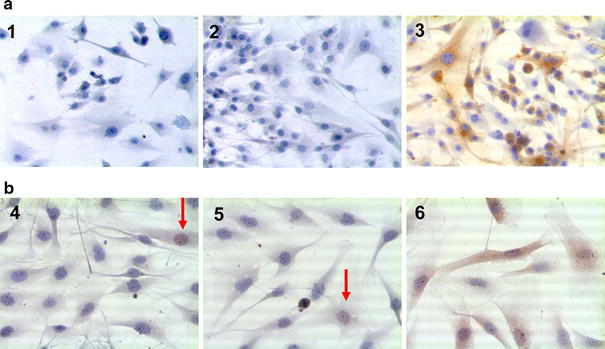
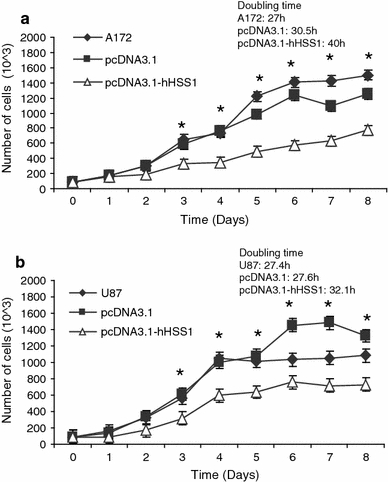
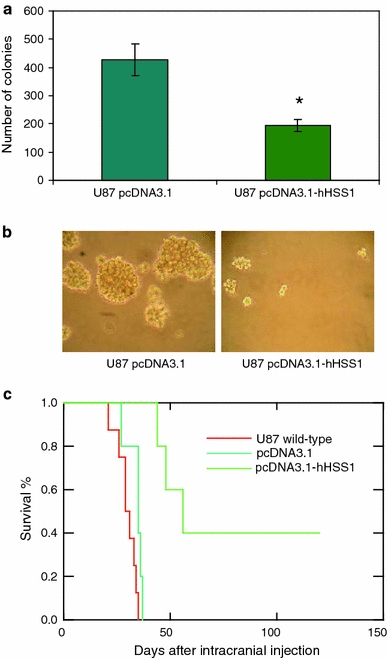
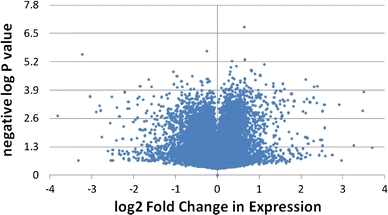
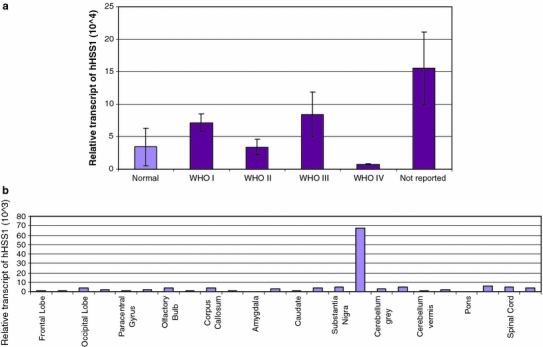
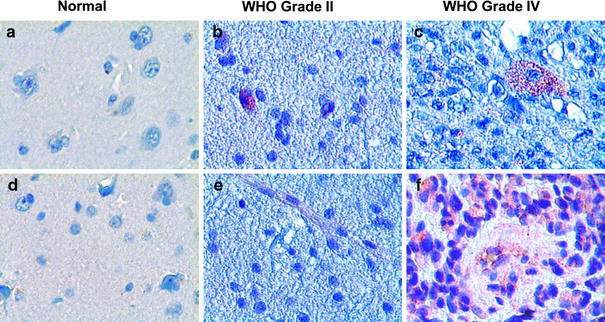
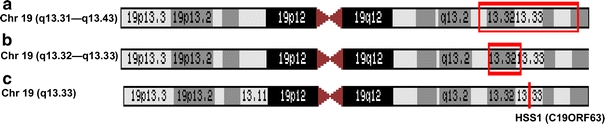
The completion of the Human Genome Project resulted in discovery of many unknown novel genes. This feat paved the way for the future development of novel therapeutics for the treatment of human disease based on novel biological functions and pathways. Towards this aim, we undertook a bioinformatics analysis of in-house microarray data derived from purified hematopoietic stem cell populations. This effort led to the discovery of HSS1 (Hematopoietic Signal peptide-containing Secreted 1) and its splice variant HSM1 (Hematopoietic Signal peptide-containing Membrane domain-containing 1). HSS1 gene is evolutionarily conserved across species, phyla and even kingdoms, including mammals, invertebrates and plants. Structural analysis showed no homology between HSS1 and known proteins or known protein domains, indicating that it was a truly novel protein. Interestingly, the human HSS1 (hHSS1) gene is located at chromosome 19q13.33, a genomic region implicated in various cancers, including malignant glioma. Stable expression of hHSS1 in glioma-derived A172 and U87 cell lines greatly reduced their proliferation rates compared to mock-transfected cells. hHSS1 expression significantly affected the malignant phenotype of U87 cells both in vitro and in vivo. Further, preliminary immunohistochemical analysis revealed an increase in hHSS1/HSM1 immunoreactivity in two out of four high-grade astrocytomas (glioblastoma multiforme, WHO IV) as compared to low expression in all four low-grade diffuse astrocytomas (WHO grade II). High-expression of hHSS1 in high-grade gliomas was further supported by microarray data, which indicated that mesenchymal subclass gliomas exclusively up-regulated hHSS1. Our data reveal that HSS1 is a truly novel protein defining a new class of secreted factors, and that it may have an important role in cancer, particularly glioma.


Figures

Fig. 1
Fig. 1
a Protein sequence alignment for HSS1 and HSM1. Homology between the two splice variants in mouse and human are shown. Identical residues are indicated by asterisks. Shaded regions represent as follows: predicted signal peptide (light grey); predicted N-and O-glycosylation sites at the amino acid positions 182 and 198 (black box); predicted transmembrane domain for hHSM1 (dark grey, note it contains the ultimate intron–exon splice boundary which gives rise to the different forms of the gene): intron–exon junctions (bold underlined). b Intron–exon arrangement of hHSS1/HSM1. Each HSS1 and HSM1 contains seven exons. The last exon differs in both forms of the protein. Small arrows indicate PCR primer sites. TGA: stop codon. The two forms of the gene are encoded at locus 19q13.33
Fig. 2
Fig. 2
a Phylogram of HSS1/HSM1 protein sequences. Alignment of HSS1/HSM1 protein sequences from 24 species using ClustalW2 (http://www.ebi.ac.uk/Tools/clustalw2/index.html). HSS1/HSM1 has identified orthologs in at least 45 species, of which 24 are shown. b and c Overlay of TOP7 fold with the HSS1/HSM1 predicted fold. b Alignment of TOP7 (blue) and HSS1/HSM1 (green) β-sheets (amino acids 54–159); c alignment of TOP7 (red) and HSS1/HSM1 (green) alpha-helices. The predicted probability of these two domains aligning by chance is P < 0.05
Fig. 3
Fig. 3
HSS1 is secreted and multi-glycosylated a Western blot analysis obtained from 293T cells transfected with the pTT3-hHSS1 construct in serum or serum-free medium. The protein was detected with anti-His-tag antibody. Samples were also digested with enzymes that selectively cleave glycosylated proteins. His Tag ladder (lane 1); denatured cell lysate (lane 2); cell lysate treated with different enzymes (lanes 3, 4 and 5); denatured supernatant from cells grown in medium with serum (lane 6); supernatant with serum treated with different enzymes (lanes 7, 8 and 9); denatured supernatant from cells grown in serum-free medium (lane 10); supernatant serum-free treated with different enzymes (lanes 11, 12 and 13). b Western blot analysis from 293T cell. Serum free supernatant and cell lysate of 293T cells transiently transfected with hHSS1 (lanes 2 and 4, respectively). Serum free supernatant and cell lysate of wild type 293T cells (lanes 3 and 5, respectively)
Fig. 4
Fig. 4
Growth inhibitory effect of hHSS1 in glioma cells a RT-PCR analysis of the clones stably transfected with pcDNA3.1-hHSS1 or pcDNA3.1 empty vector selected for the experiments. A172 and U87 cell lines do not express detectable levels of hHSS1 (or hHSM1) (lanes 1 and 4, upper panel). PCR product from the stable clones expressing HSS1 (lanes 2 and 5) and mock-transfected cells (lanes 3 and 6); C1, positive control: 100 ng of pcDNA3.1-hHSS1 plasmid; C2, negative control: reaction reagent only. b A172 pcDNA3.1 and pcDNA3.1-hHSS1 transfected cells were seeded (8 × 104 cells) and harvested after 7 days for cell counting by trypan blue exclusion. c hHSS1 expression suppresses colony formation in A172. A172 pcDNA3.1 and pcDNA3.1-hHSS1 transfected cells were seeded (2 × 103 cells), and after 23 days cells were stained with neutral red. d U87 pcDNA3.1 and pcDNA3.1-hHSS1 transfected cells were seeded (8 × 104 cells) and harvested after 6 days for cell counting by trypan blue exclusion. e and f hHSS1 expression decreases U87 cell aggregation in culture. e U87 cells (5 × 103) were seeded in septuplicate in 96-well plates and incubated for 3 days, and then cell aggregates were photographed and counted. f hHSS1-expressing cells presented a much flatter shape while the control cells typically grew in cell aggregates. All results are presented as grand mean ± SEM of two independent experiments. * P < 0.05, two-tailed independent Student’s t-test
Fig. 5
Fig. 5
Immunocytochemical localization of hHSS1 in cultured glioma-derived cells. a: 1, U87 wild type cells; 2, pcDNA3.1-transfected U87 cells; 3, pcDNA3.1-hHSS1 transfected U87 cells. Pictures shown represent cells stained using anti-rabbit antibody against hHSS1. b: 4, A172 wild type cells; 5, pcDNA3.1-transfected A172 cells; 6, pcDNA3.1-hHSS1 A172 transfected cells. Red arrows nuclear staining. Images are shown in the same magnification (200×)
Fig. 6
Fig. 6
hHSS1 expression inhibits A172 and U87 cell doubling. a and b A172 and U87 cells (wild-type, pcDNA3.1, pcDNA3.1-hHSS1) were cultured at nine different time points, harvested and counted by trypan blue exclusion. a hHSS1 significantly inhibited the proliferation of A172 cells after 3 days in culture (*P < 0.05, post-ANOVA pairwise Tukey test). b hHSS1 significantly inhibited the proliferation of U87 cells after 3 days in culture (*P < 0.05, post-ANOVA pairwise Tukey test). Results are shown as grand mean ± SEM of two independent experiments
Fig. 7
Fig. 7
hHSS1 suppresses anchorage-independent growth and tumorigenicity of U87 cells. a U87 cells (pcDNA3.1, pcDNA3.1-hHSS1) were seeded on top of soft agar in 10 cm plates and the number of colonies formed in soft agar were counted after 23 days of incubation. Results are expressed as grand mean ± SEM and are representative of two independent experiments. * P < 0.05, Student’s t-test, pcDNA3.1-hHSS1 versus U87 wild-type or versus mock-transfected cells. b Micrograph of U87 colonies grown in soft agar: pcDNA3.1: mock-transfected cells, pcDNA3.1-hHSS1: cells stably expressing hHSS1. c Kaplan–Meier analysis of nude mice intracranially injected with 1 × 106 U87 cells expressing hHSS1 (N = 5), U87 wild-type (N = 8) or mock-transfected cells (N = 5) (Mantel test, P < 0.001,). Survival and tumor growth were monitored daily
Fig. 8
Fig. 8
Volcano plot for 491 differentially hHSS1-regulated genes in U87 stable transfected cells. Values outside −1 and +1 fold change and values above negative log P-value 1.3 (P = 0.05) were considered statistically significant down- (left) and up-regulated (right)
Fig. 9
Fig. 9
a Expression profiles of hHSS1 in brain cancer according to WHO classification. TissueScan Brain Cancer Tissue qRT-PCR Array I consisting of 48 human brain tissues was used to determine transcript levels of hHSS1. Data were normalized to β-actin levels. Error bars displays the SEM. b Expression profiles of hHSS1 in human brain tissues (Human Brain Tissue qPCR Panel I). Data were normalized to GAPDH levels
Fig. 10
Fig. 10
Immunohistochemical analysis of hHSS1 in representative cases of glioma. a, d No obvious immunoreactivity was detectable in normal brain tissues). b, e hHSS1 immunoreactivity was low in low-grade diffuse astrocytoma (WHO grade II). c, f low and high expression of hHSS1 in high-grade astrocytoma (glioblastoma multiforme, WHO grade IV). Sections were stained using anti-rabbit antibody against hHSS1. Images are shown in the same magnification (200×)
Fig. 11
Fig. 11
Expression of hHSS1 by glioma molecular subclasses. Expression data from 100 primary gliomas from MD Anderson Hospital patients (GEO accession #GSE4271) were arranged into Mesenchymal (MES; n = 35), Proneural (PN; n = 37), and Proliferative (Prolif; n = 28) groups according to Phillips et al. [8]. hHSS1 probeset (Affymetrix HG-U133, 224727_at) expression was assessed in each group from MAS5-normalized data. Statistical differences between groups was evaluated using one-tailed t-test after adjustment for variance, with P values as shown. Mean expression ± SEM was as follows: MES, 3057 ± 211; PN, 2408 ± 125; Prolif, 2345 ± 244
Fig. 12
Fig. 12
Mapped position of the putative glioma tumor suppressor at chromosome 19q region a Chromosome 19 (q13.31–q13.43), region of the putative glioma tumor suppressor suggested by von Deimling et al. [20], between the markers D19S178 and D19S180 (red rectangle). This region includes the hHSS1 gene (C19orf63). b Chromosome 19 (q13.32–q13.33), region of the putative glioma tumor suppressor gene narrowed by Rubio et al. [5] (smaller red rectangle). This region is situated between the loci APOC2 and HRC, which excludes the hHSS1 gene. c Chromosome 19q13.33, red bar represent the genome location of hHSS1. The UCSC database was used as reference (http://genome.ucsc.edu/cgi-bin/hgGateway)

References

    1. Venter JC, Adams MD, Myers EW, et al. The sequence of the human genome. Science. 2001;291:1304–1351. doi: 10.1126/science.1058040. - DOI - PubMed
    1. Lander ES, Linton LM, Birren B, et al. Initial sequencing and analysis of the human genome. Nature. 2001;409:860–921. doi: 10.1038/35057062. - DOI - PubMed
    1. Pawlowski K. Uncharacterized/hypothetical proteins in biomedical ‘omics’ experiments: is novelty being swept under the carpet? Brief Funct Genomic Proteomic. 2008;7(4):283–290. doi: 10.1093/bfgp/eln033. - DOI - PubMed
    1. Zhong JF, Zhao Y, Sutton S, et al. Gene expression profile of murine long-term reconstituting vs. short-term reconstituting hematopoietic stem cells. PNAS. 2005;102:2448–2453. doi: 10.1073/pnas.0409459102. - DOI - PMC - PubMed
    1. Rubio M-P, Correa KM, Ueki K, et al. The putative glioma tumor suppressor gene on chromosome 19q maps between APOC2 and HRC1. Cancer Res. 1994;54:4760–4763. - PubMed

Publication types

MeSH terms