

Novel N-methylated 8-oxoisoguanines from Pacific sponges with diverse neuroactivities
- PMID: 20681583
- PMCID: PMC3241477
- DOI: 10.1021/jm100490m
Novel N-methylated 8-oxoisoguanines from Pacific sponges with diverse neuroactivities
Abstract
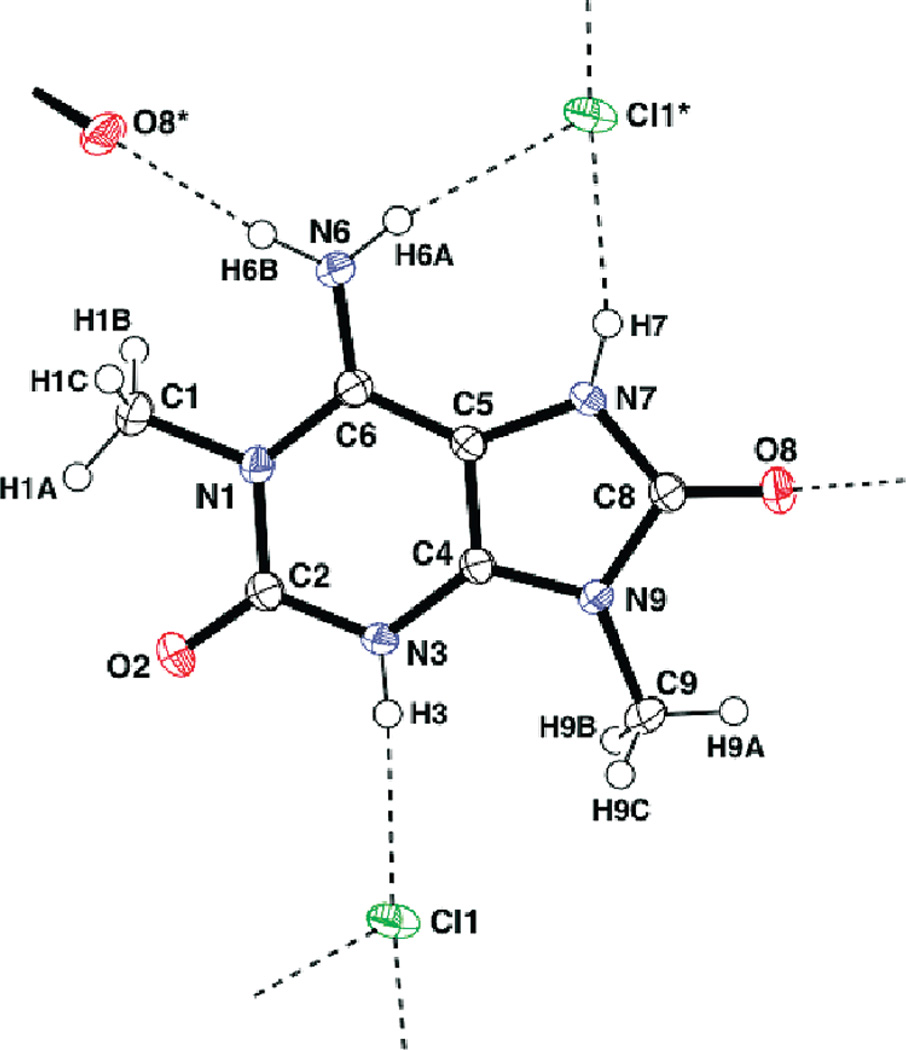
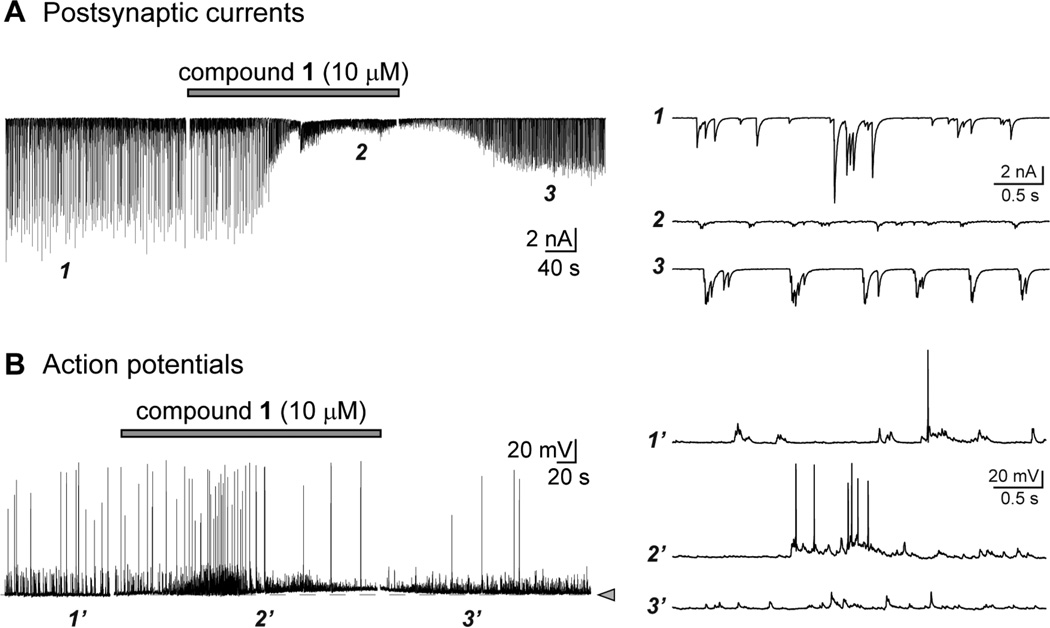
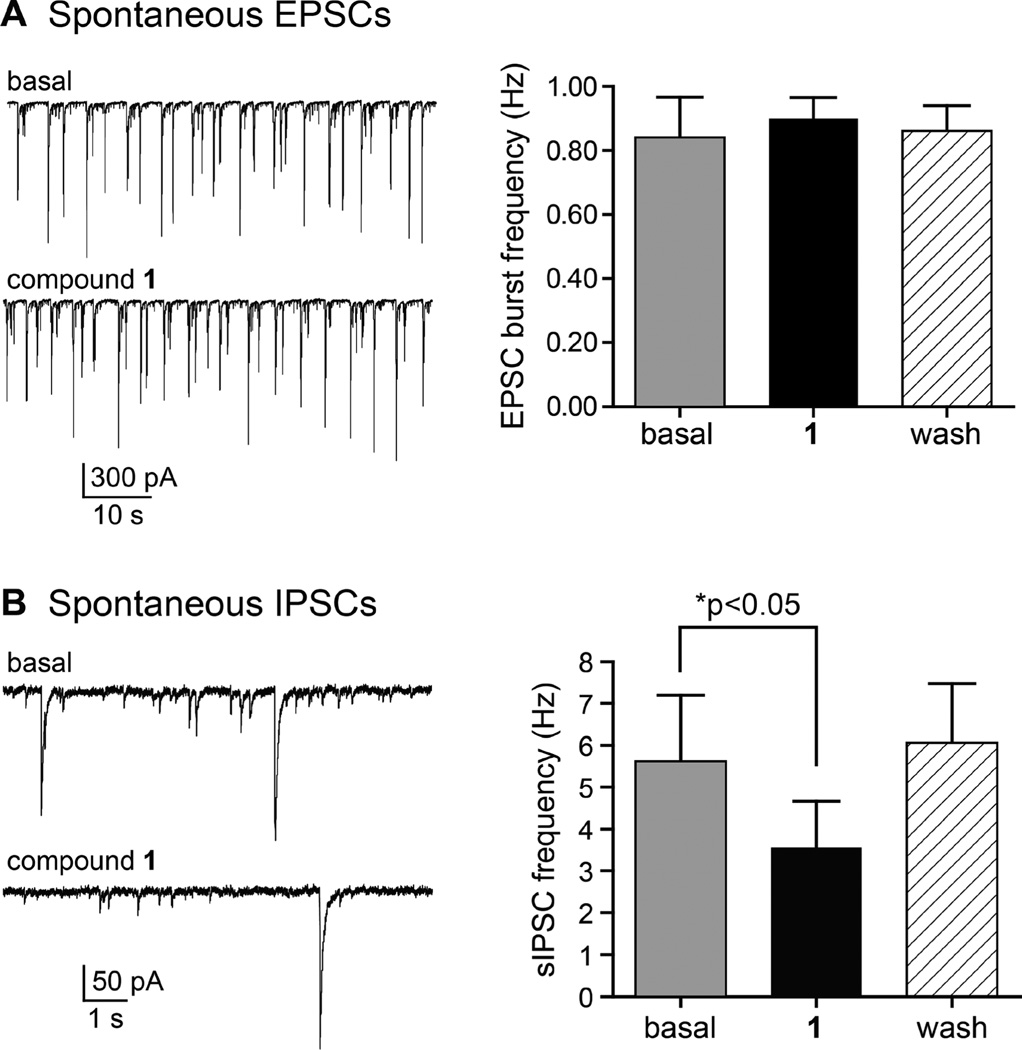
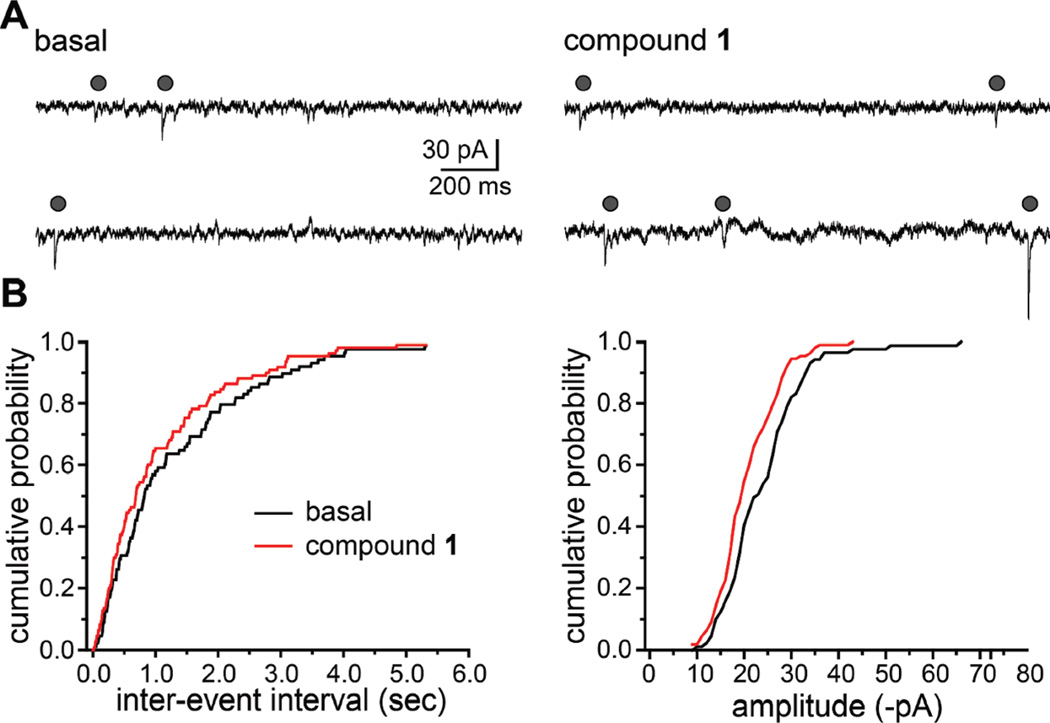
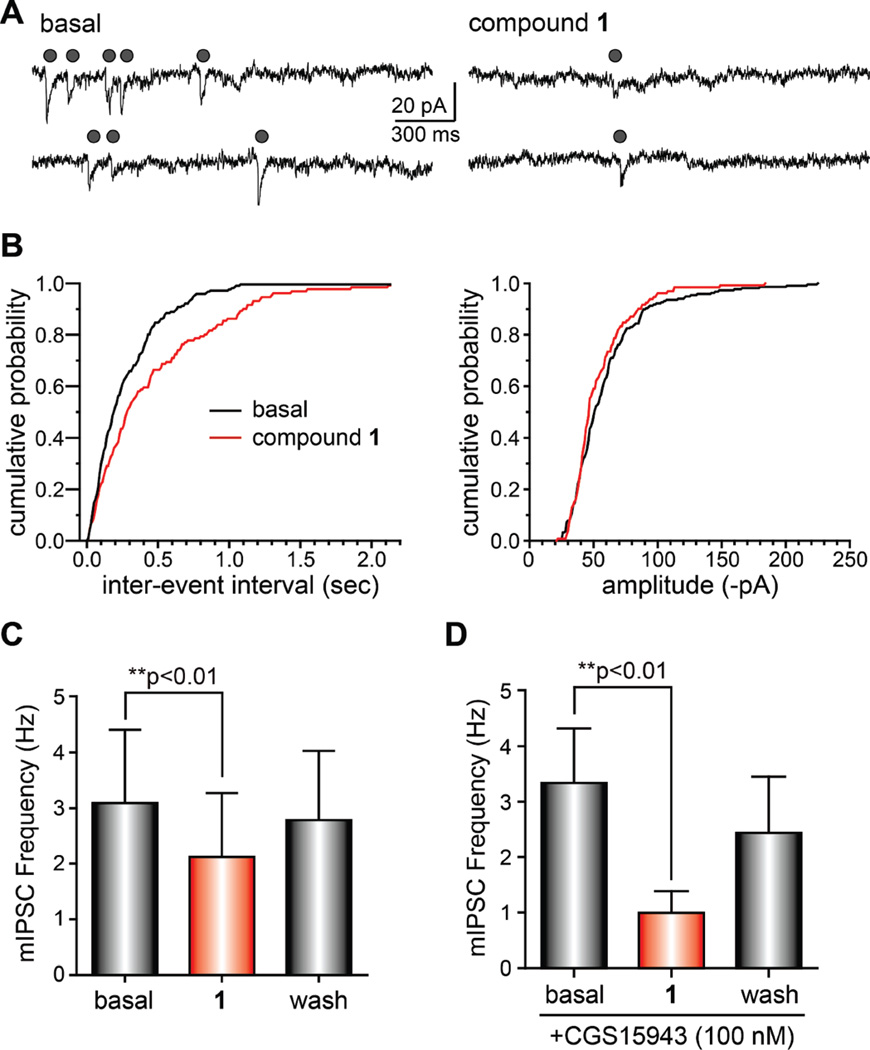
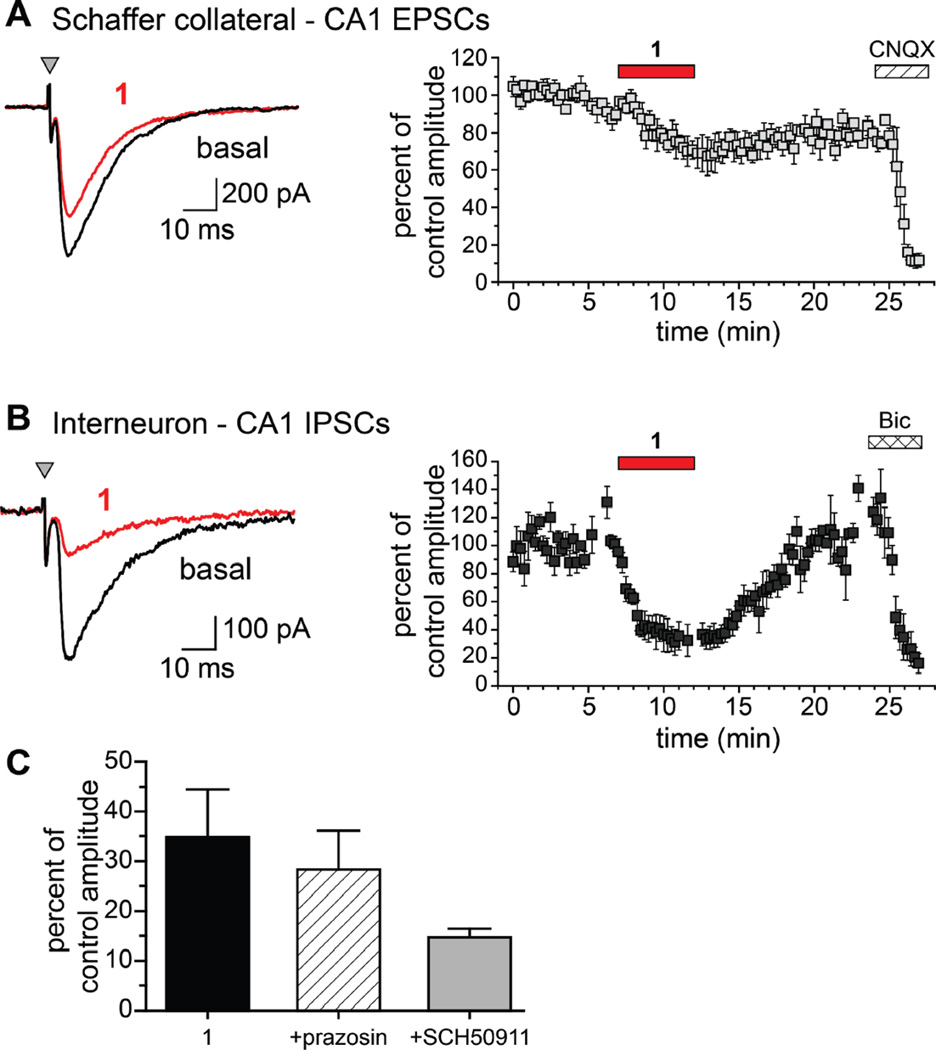
Marine organisms have yielded a variety of metabolites with neuropharmacological applications. Here we describe the isolation and pharmacological characterization of four novel, neurologically active purines 1-4, isolated from Haplosclerida sponges collected in the Republic of Palau. The structures were determined by analyses of spectral and X-ray data. Compound 1 induced convulsions upon intracerebroventricular injection into mice, with a CD50 value of 2.4 nmol/mouse. Purines 2-4 were active in mouse bioassays at higher doses. The seizurogenic activity of 1 was correlated with inhibition of neuronal GABAergic transmission, with only a modest impact on excitatory signaling, in electrophysiological recordings from hippocampal neurons. Despite having a purine template structure, the inhibitory activity of 1 was not prevented by a nonselective adenosine receptor antagonist. Thus, 1 represents a novel substituted purine that elicits convulsions through its actions on inhibitory neurotransmission. These 8-oxoisoguanine analogs comprise a new family of compounds closely related in structure to endogenous neurosignaling molecules and commonly used CNS stimulants.
Figures
Similar articles
-
The pro-convulsant actions of corticotropin-releasing hormone in the hippocampus of infant rats.Neuroscience. 1998 May;84(1):71-9. doi: 10.1016/s0306-4522(97)00499-5. Neuroscience. 1998. PMID: 9522363 Free PMC article.
-
Synaptic connections from multiple subfields contribute to granule cell hyperexcitability in hippocampal slice cultures.J Neurophysiol. 2000 Dec;84(6):2918-32. doi: 10.1152/jn.2000.84.6.2918. J Neurophysiol. 2000. PMID: 11110821
-
Flufenamic acid suppresses epileptiform activity in hippocampus by reducing excitatory synaptic transmission and neuronal excitability.Epilepsia. 2010 Mar;51(3):384-90. doi: 10.1111/j.1528-1167.2009.02279.x. Epub 2009 Sep 3. Epilepsia. 2010. PMID: 19732136
-
Neurochemical, electrophysiological and pharmacological profiles of the selective inhibitor of the glycine transporter-1 SSR504734, a potential new type of antipsychotic.Neuropsychopharmacology. 2005 Nov;30(11):1963-85. doi: 10.1038/sj.npp.1300772. Neuropsychopharmacology. 2005. PMID: 15956994
-
Long-term regulation of excitatory and inhibitory synaptic transmission in hippocampal cultures by brain-derived neurotrophic factor.Prog Brain Res. 2000;128:203-18. doi: 10.1016/s0079-6123(00)28018-7. Prog Brain Res. 2000. PMID: 11105680 Review. No abstract available.
Cited by
-
Small Molecules in the Cone Snail Arsenal.Org Lett. 2015 Oct 16;17(20):4933-5. doi: 10.1021/acs.orglett.5b02389. Epub 2015 Sep 30. Org Lett. 2015. PMID: 26421741 Free PMC article.
-
Recent progress in neuroactive marine natural products.Nat Prod Rep. 2014 Jan 17;31(2):273-309. doi: 10.1039/c3np70083f. Nat Prod Rep. 2014. PMID: 24430532 Free PMC article. Review.
-
Natural Product Repertoire of the Genus Amphimedon.Mar Drugs. 2018 Dec 30;17(1):19. doi: 10.3390/md17010019. Mar Drugs. 2018. PMID: 30598005 Free PMC article. Review.
-
Marine Alkylpurines: A Promising Group of Bioactive Marine Natural Products.Mar Drugs. 2018 Jan 1;16(1):6. doi: 10.3390/md16010006. Mar Drugs. 2018. PMID: 29301246 Free PMC article. Review.
-
Isolation of novel prototype galectins from the marine ball sponge Cinachyrella sp. guided by their modulatory activity on mammalian glutamate-gated ion channels.Glycobiology. 2013 Apr;23(4):412-25. doi: 10.1093/glycob/cws165. Epub 2012 Dec 4. Glycobiology. 2013. PMID: 23213112 Free PMC article.
References
-
- Rosemeyer H. The chemodiversity of purine as a constituent of natural products. Chem. Biodiversity. 2004;1:361–401. - PubMed
-
- Mitchell SS, Whitehill AB, Trapido-Rosenthal HG, Ireland CM. Isolation and characterization of 1,3-dimethylisoguanine from the Bermudian sponge Amphimedon viridis. J. Nat. Prod. 1997;60:727–728. - PubMed
-
- Moon B, Baker BJ, McClintock JB. Purine and nucleoside metabolites from the Antarctic sponge Isodictya erinacea. J. Nat. Prod. 1998;61:116–118. - PubMed
-
- Cafieri F, Fattorusso E, Mangoni A, Taglialatelascafati O. Longamide and 3,7-dimethylisoguanine, two novel alkaloids from the marine sponge Agelas longissima. Tetrahedron Lett. 1995;36:7893–7896.
Publication types
MeSH terms
Substances
Grants and funding
LinkOut - more resources
Full Text Sources
Chemical Information
