. 2010 Aug 11;58(15):8573-84.
doi: 10.1021/jf1014268.

Enrichment of Echinacea angustifolia with Bauer alkylamide 11 and Bauer ketone 23 increased anti-inflammatory potential through interference with cox-2 enzyme activity

Affiliations

Enrichment of Echinacea angustifolia with Bauer alkylamide 11 and Bauer ketone 23 increased anti-inflammatory potential through interference with cox-2 enzyme activity

Carlie A Lalone et al. J Agric Food Chem. .

Abstract

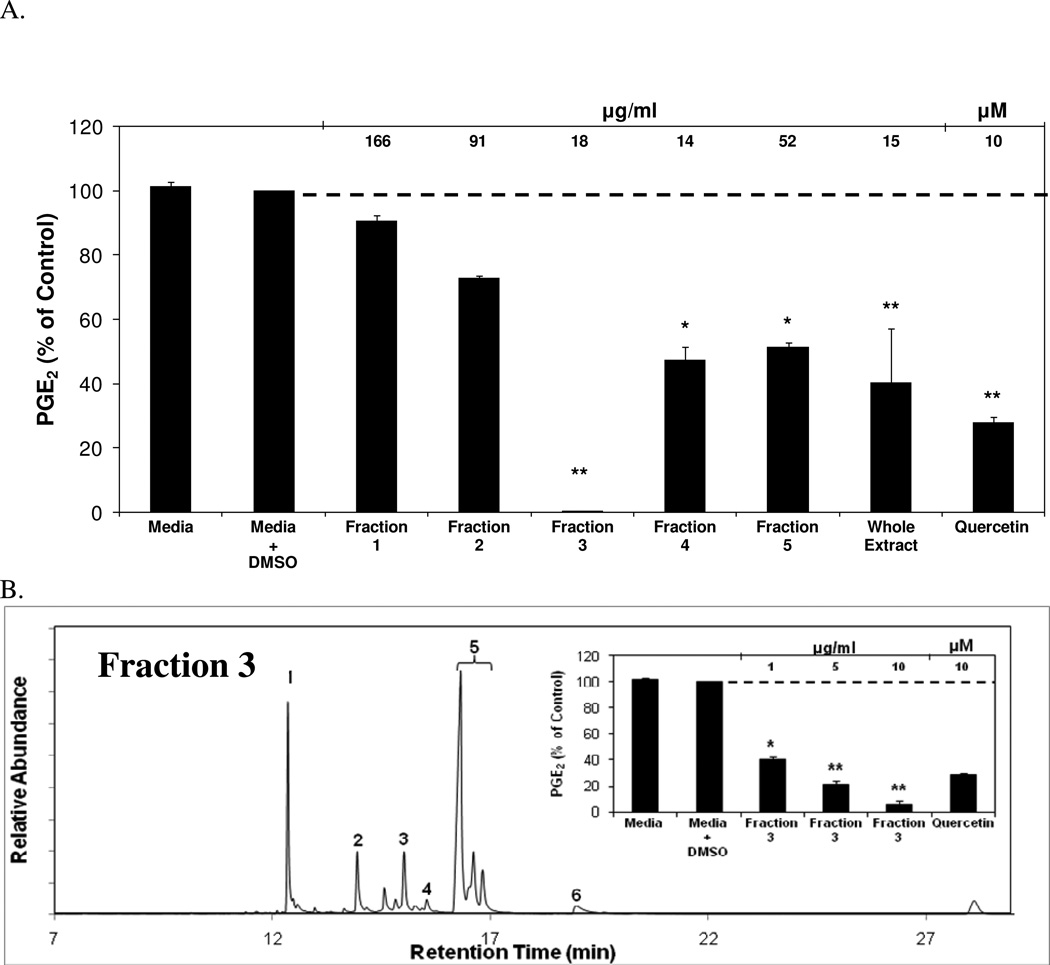
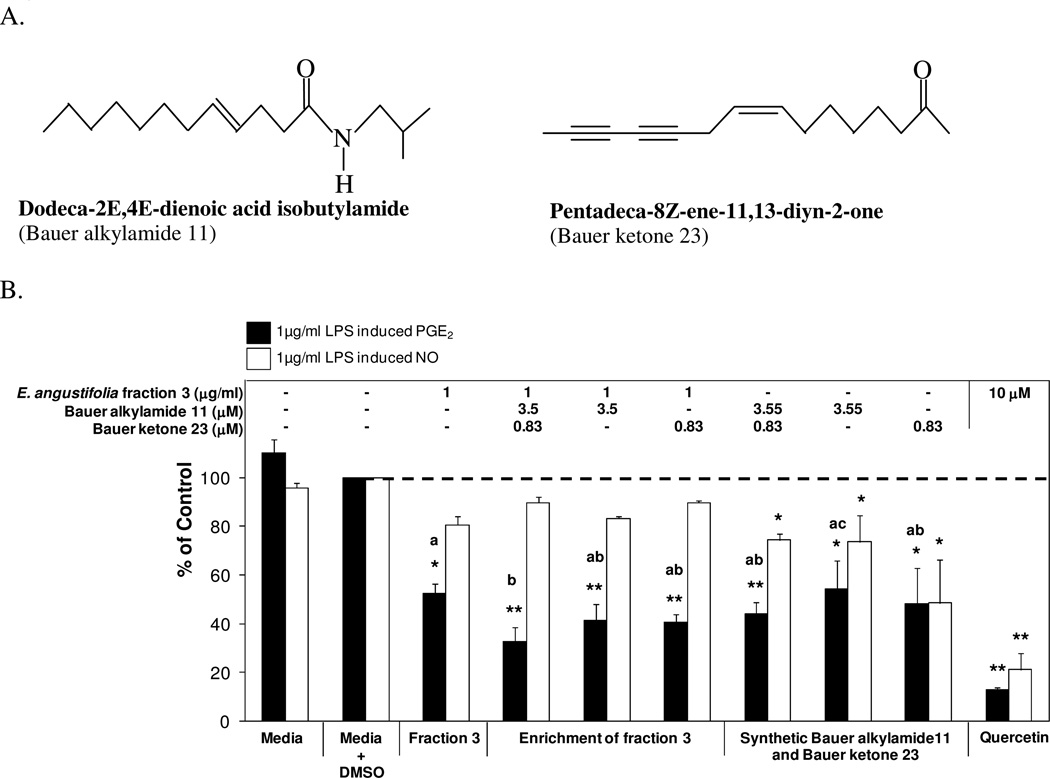
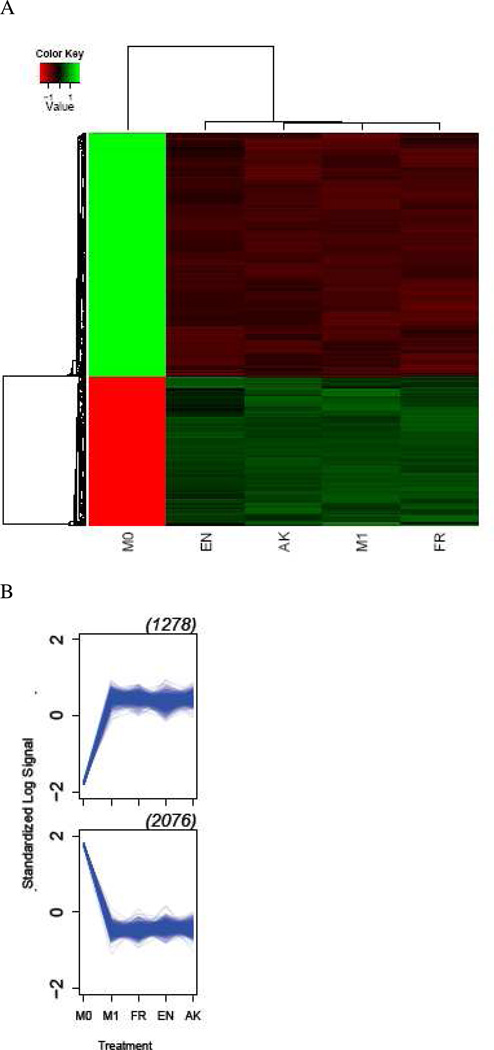
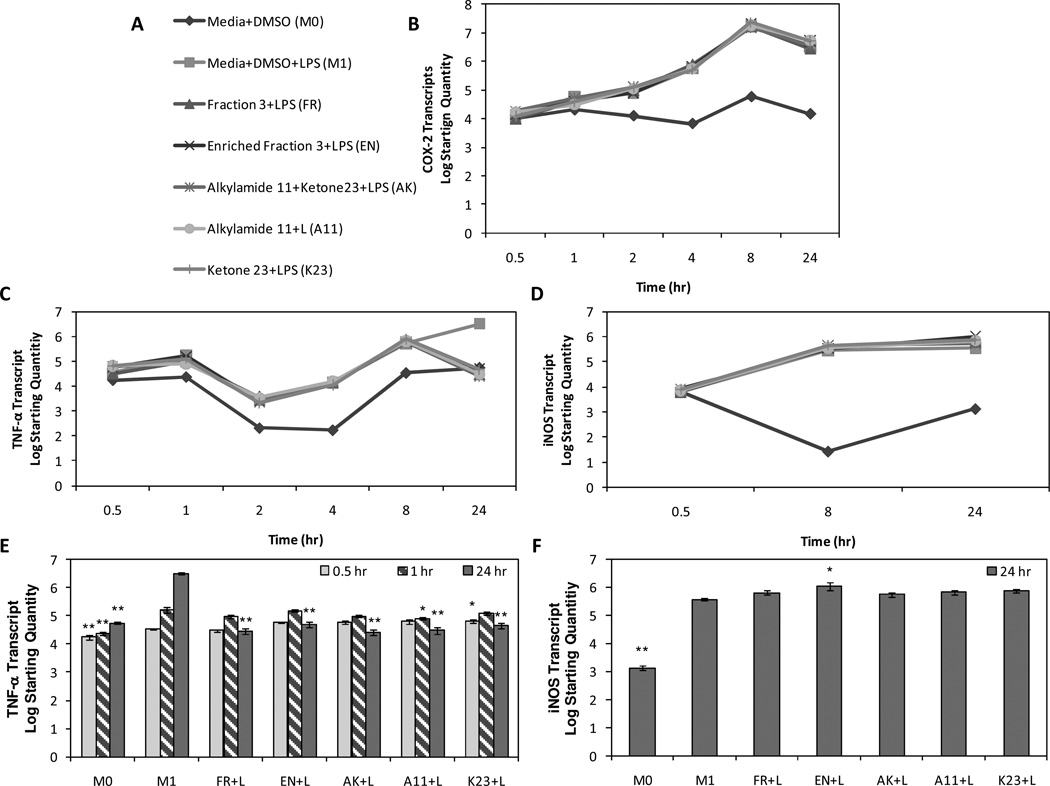
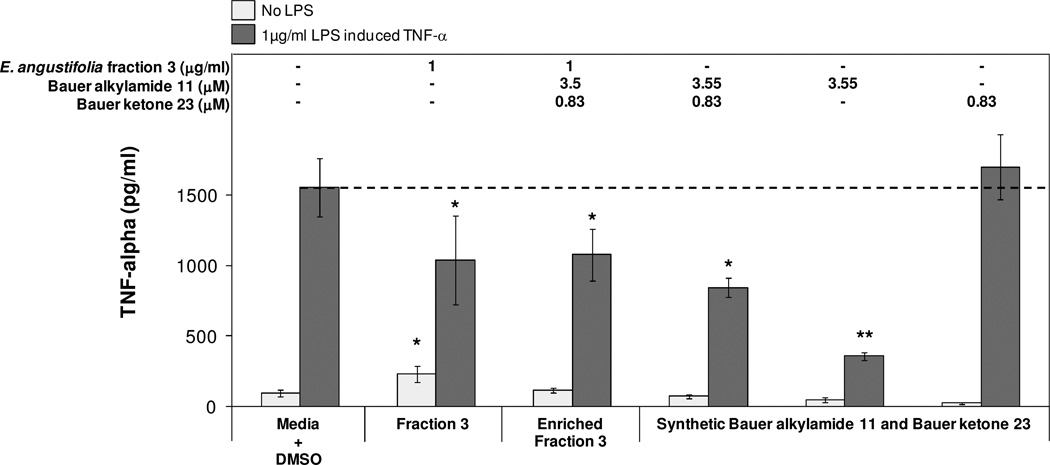
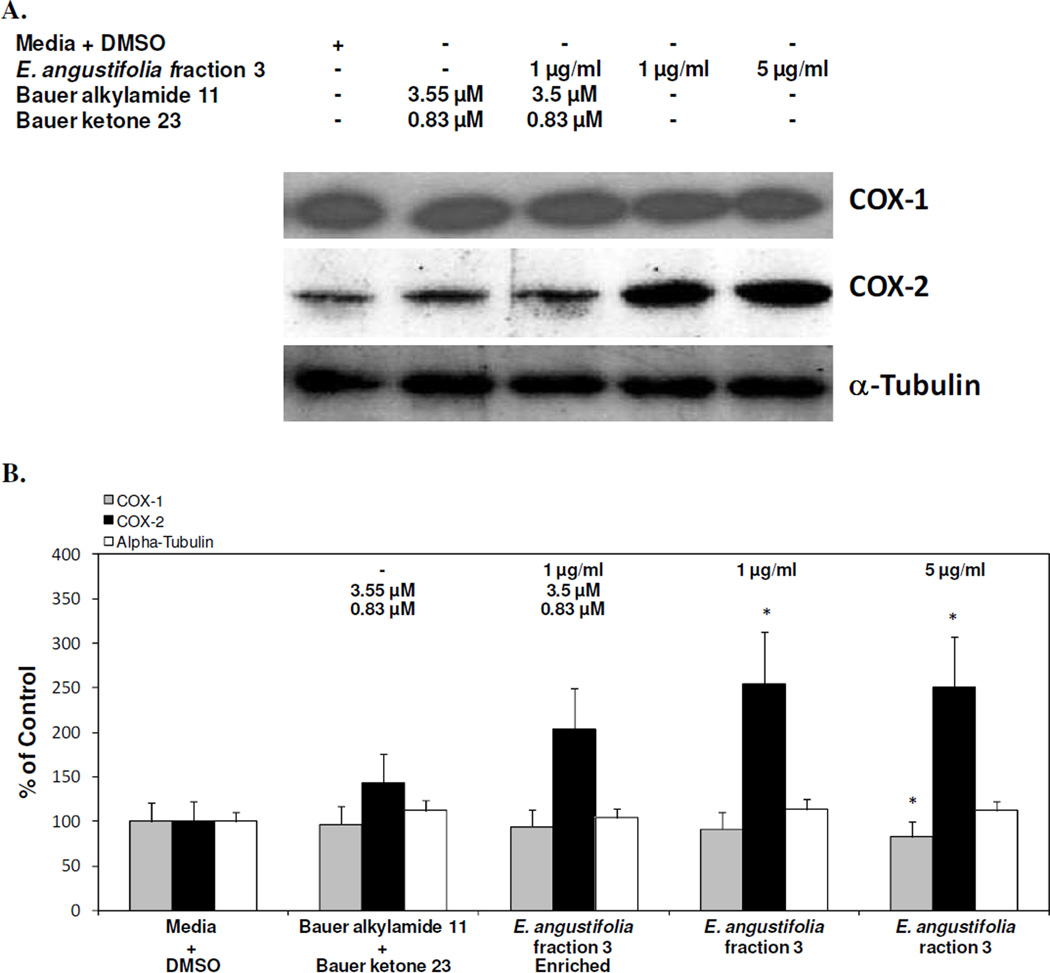
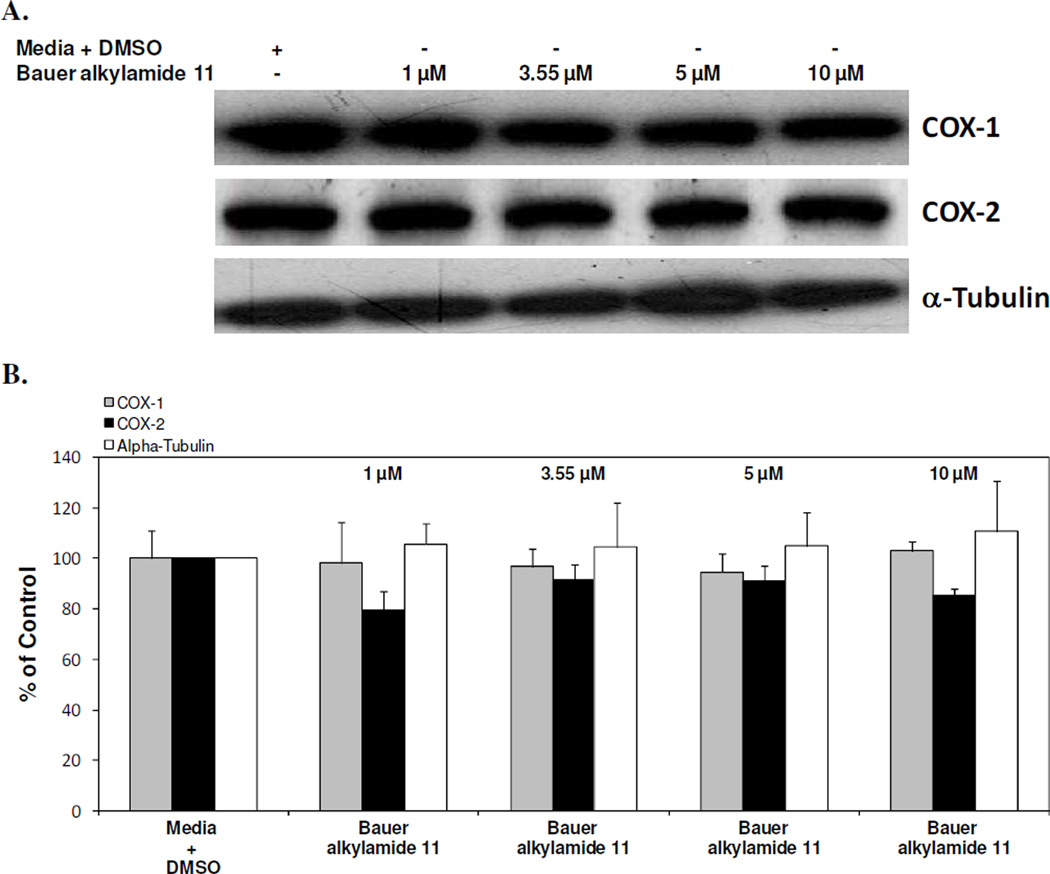
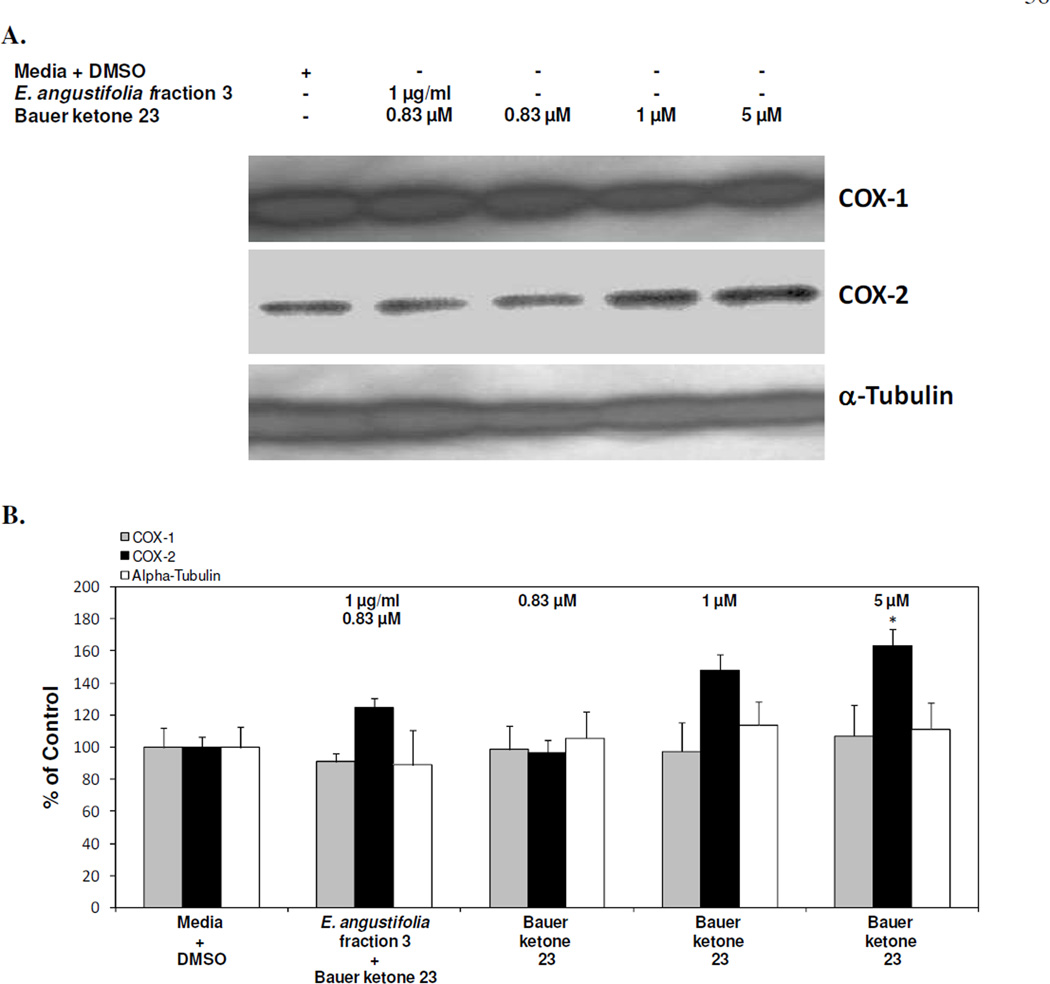
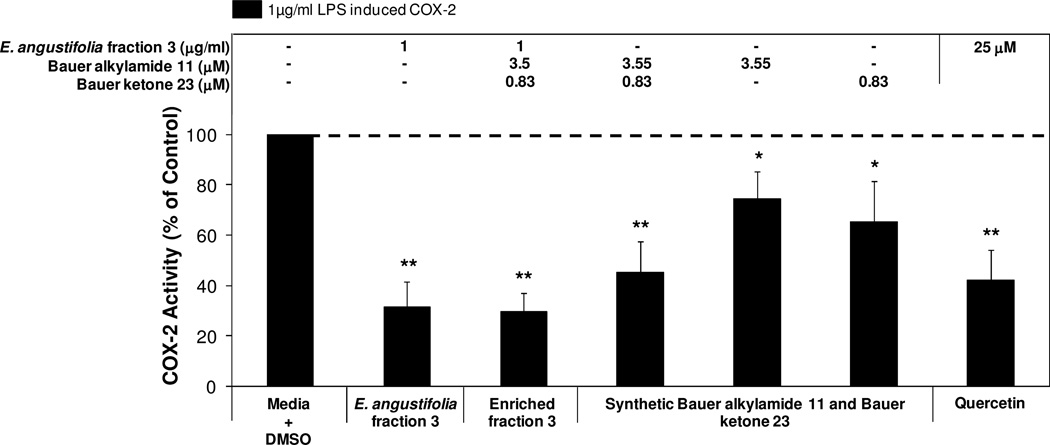
Bauer alkylamide 11 and Bauer ketone 23 were previously found to be partially responsible for Echinacea angustifolia anti-inflammatory properties. This study further tested their importance using the inhibition of prostaglandin E(2) (PGE(2)) and nitric oxide (NO) production by RAW264.7 mouse macrophages in the absence and presence of lipopolysaccharide (LPS) and E. angustifolia extracts, phytochemical enriched fractions, or pure synthesized standards. Molecular targets were probed using microarray, qRT-PCR, Western blot, and enzyme assays. Fractions with these phytochemicals were more potent inhibitors of LPS-induced PGE(2) production than E. angustifolia extracts. Microarray did not detect changes in transcripts with phytochemical treatments; however, qRT-PCR showed a decrease in TNF-alpha and an increase of iNOS transcripts. LPS-induced COX-2 protein was increased by an E. angustifolia fraction containing Bauer ketone 23 and by pure phytochemical. COX-2 activity was decreased with all treatments. The phytochemical inhibition of PGE(2) production by Echinacea may be due to the direct targeting of COX-2 enzyme.


Figures

Figure 1
Figure 1
A. Fraction 3 from a 2009 extract of Echinacea angustifolia (PI631293) significantly inhibited PGE2 production in RAW264.7 cells. The black bars represent PGE2 levels after induction with 1 µg/ml LPS and treatment with an Echinacea fraction or ethanol extract (n = 3). All treatments + LPS were compared to media + DMSO + LPS control that was set at 100 % (4.3 ng/ml). Treatments were also performed without LPS induction showing significant reduction in PGE2 production with fractions 2, 3, and 5 (p < 0.04). The treatments without LPS were compared to the media + DMSO control set at 100 % (0.03 ng/ml). * and ** are representative of p<0.05 and p<0.01. Each bar represents % of control ± standard error. Parallel cytotoxicity screens were conducted yielding no significant cytotoxicity with any of the fractions or the extract (data not shown). B. Gas chromatography analysis of bioactive fraction 3 from E. angustifolia. Total ion chromatograms of fractions 3 with peaks whose chemical identity was established by comparing their retention times and mass-spectra to authentic standards: Bauer alkylamide 13 (1), Bauer alklyamide 12 (2), Bauer alkylamide 10 (3), Bauer alkylamide 11 (4), Bauer alkylamide 8/9 (5), and Bauer alkylamide 14 (6). Quantification of Bauer alkylamide 11 yielded a concentration of 0.05 µM.
Figure 2
Figure 2
A. Structures and nomenclature for Bauer alkylamide 11 and Bauer ketone 23. B.Lipopolysaccharide induced PGE2 and NO production in RAW264.7 cells treated with E. angustifolia fraction, enhanced fraction, and chemically synthesized Bauer alkylamide 11 and ketone 23. The black bars represent PGE2 levels and the white bars represent NO levels after induction with 1 µg/ml LPS and treatment (n = 3). All treatments + LPS were compared to media + DMSO + LPS control that was set at 100 % PGE2 production (2.5 ng/ml) and NO production (18.8 ng/ml). The treatments without LPS were compared to the media + DMSO control set at 100 % PGE2 production (0.05 ng/ml) and NO production (~0 ng/ml) identifying no significant differences with treatment for either endpoint. Quercetin was used as a positive control for both studies and showed significant inhibition of PGE2 and NO production (p<0.0001). * and ** are representative of p<0.05 and p<0.001. Each bar represents % of control ± standard error. Parallel cytotoxicity screens were conducted yielding no significant cytotoxicity with any of the treatments or combination of treatments (data not shown).
Figure 3
Figure 3
A. Hierarchical cluster analysis of differentially expressed genes in RAW264.7 mouse macrophages. 3,354 differentially expressed probesets were identified comparing the media + DMSO control to the media + DMSO + LPS control with a FDR of 0.001%, with no differentially expressed genes identified between treatments with LPS. On the heatmap, the rows represent the genes and the columns represent the treatments. The red color is indicative of low gene expression and green is indicative of high gene expression. Treatments are labeled as follows: M0 = Media + DMSO control, M1 = Media + DMSO + LPS control, FR = E. angustifolia fraction 3, EN = E. angustifolia fraction 3 enriched with synthetic Bauer alkylamide 11 and Bauer ketone 23, and AK = combination of synthetic Bauer alkylamide 11 and Bauer ketone 23. B. Standardized log signal for the two clusters identified in the analysis represents changes in gene expression level with different treatment groups. The number of probesets is given in parentheses on the right above the cluster graph.
Figure 4
Figure 4
A. Legend for qRT-PCR treatments. B. Analysis of qRT-PCR time course for COX-2 gene expression. N=3 for each treatment. Standard errors ranged from 0.02 to 0.16 TNF-α transcript log starting quantity for all treatments and time points. C. Analysis of qRT-PCR time course for TNF-α gene expression. N=3 for each treatment. Standard errors ranged from 0.03 to 0.16 TNF-α transcript log starting quantity for all treatments and time points. * and ** are representative of p<0.05 and p<0.01. D. Analysis of qRT-PCR time course for iNOS gene expression. N=3 for each treatment. Standard errors ranged from 0.03 to 0.24 for all treatments and time points. * and ** are representative of p<0.05 and p<0.01. E. qRT-PCR nalysis at time points with significant treatment effects for TNF-α gene when compared to the media + DMSO + LPS control. * and ** are representative of p<0.05 and p<0.01. Bars represent the mean ± standard error. F. qRT-PCR analysis at time point with significant treatment effect for iNOS gene when compared to the media + DMSO + LPS control. * and ** are representative of p<0.05 and p<0.01. Bars represent the mean ± standard error.
Figure 5
Figure 5
Lipopolysaccharide induced TNF-α production in RAW264.7 cells treated with E. angustifolia fraction, enhanced fraction, and chemically synthesized Bauer alkylamide 11 and ketones 23. The light grey bars represent TNF-α levels after treatment with Echinacea fraction, enriched fraction or compounds. The dark grey bars represent TNF-α levels after induction with 1 µg/ml LPS and treatment (n = 3). All treatments + LPS were compared to media + DMSO + LPS control. The treatments without LPS were compared to the media + DMSO control. (p<0.0001). * and ** are representative of p<0.05 and p<0.01. Each bar represents mean ± standard error.
Figure 6
Figure 6
A. Analysis of LPS induced COX-1, COX-2, and α-tubulin protein levels in RAW264.7 cells with representative western blots for E. angustifolia fraction 3, enriched fraction 3, and the combination of Bauer alkylamide 11 and ketone 23. N=3 for each blot. B. Semi-quantitative representation of the blots from Figure 6A. Bars represent mean percent of media + DMSO + LPS control ± standard error. Lipopolysaccharide induced COX-2 protein from 24.3 ± 8.2% average for the media + DMSO control to 100 ± 20.6% average for the media + DMSO + LPS control. There was no significant LPS effect for the media + DMSO control with COX-1 (96.9 ± 1.8% of control average) or α-tubulin (104.4 ± 3.4% of control average) on protein level compared to the media + DMSO + LPS control. Quercetin was used as a positive control at 100 µM for the reduction of LPS induced COX-2 protein 41.3 ± 16.9% of control. Quercetin did not significantly affect LPS induced COX-1 (85.3 ± 3.2% of control average) or α-tubulin (109.6 ± 16.7 % of control average). * and ** are representative of p<0.05 and p<0.01 when compared to media + DMSO + LPS control.
Figure 7
Figure 7
A. Analysis of LPS induced COX-1, COX-2, and α-tubulin protein levels in RAW264.7 cells with representative western blots for Bauer alkylamide 11. N=3 for each blot. B. Semi-quantitative representation of the blots from Figure 7A. Bars represent mean percent of media + DMSO + LPS control ± standard error. Lipopolysaccharide induced COX-2 protein from 19.1 ± 6.2% average for the media + DMSO control to 100 ± 10.9% average for the media + DMSO + LPS control. There was no significant LPS effect for the media + DMSO control with COX-1 (83.4 ± 3.0% of control average) or α-tubulin (94.7 ± 2.1% of control average) on protein level compared to the media + DMSO + LPS control. Quercetin was used as a positive control at 100 µM for the reduction of LPS induced COX-2 protein 71.4 ± 3.1% of control. Quercetin did not significantly affect LPS induced COX-1 (96.1 ± 6.5% of control average) or α-tubulin (98.0 ± 4.3 of control average). * and ** are representative of p<0.05 and p<0.01 when compared to media + DMSO + LPS control.
Figure 8
Figure 8
A. Analysis of LPS induced COX-1, COX-2, and α-tubulin protein levels in RAW264.7 cells with representative western blots for Bauer ketone 23 individually and in combination with E. angustifolia fraction 3. N=3 for each blot. B. Semi-quantitative representation of the blots from Figure 8A. Bars represent mean percent of media + DMSO + LPS control ± standard error. Lipopolysaccharide induced COX-2 protein from 4.8 ± 2.8% average for the media + DMSO control to 100 ± 12.0% average for the media + DMSO + LPS control. There was no significant LPS effect for the media + DMSO control with COX-1 (95.4 ± 3.3% of control average) or α- tubulin (103.9 ± 7.3% of control average) on protein level compared to the media + DMSO + LPS control. Quercetin was used as a positive control at 100 µM for the reduction of LPS induced COX-2 protein 53.0 ± 15.7% of control. Quercetin did not significantly affect LPS induced COX-1 (95.5 ± 2.2% of control average) or α-tubulin (91.8 ± 9.7 of control average). * and ** are representative of p<0.05 and p<0.01 when compared to media + DMSO + LPS control.
Figure 9
Figure 9
Lipopolysaccharide induced COX-2 activity in RAW264.7 cells treated with E. angustifolia fraction, enhanced fraction, and chemically synthesized Bauer alkylamide 11 and ketones 23. The black bars represent COX-2 activity levels after induction of cells with 1 µg/ml LPS and treatment (n = 3). All treatments with added LPS were compared to a media + DMSO + LPS control that was set at 100 % COX-2 activity (5.8 nmol/min/ml). The treatments without LPS were compared to the media + DMSO control set at 100 % COX-2 activity (2.4 nmol/min/ml) identifying no significant differences. Quercetin was used as a positive control for both studies and showed significant inhibition of COX-2 activity (p<0.0001). * and ** are representative of p<0.05 and p<0.01. Each bar represents % of control ± standard error.

Similar articles

Cited by

References

    1. Borchers AT, Keen CL, Stern JS, Gershwin ME. Inflammation and Native American medicine: the role of botanicals. Am J Clin Nutr. 2000;72(2):339–347. - PubMed
    1. McCann DA, Solco A, Liu Y, Macaluso F, Murphy PA, Kohut ML, Senchina DS. Cytokine- and Interferon-Modulating Properties of Echinacea spp. Root Tinctures Stored at −20°C for 2 Years. Journal of Interferon & Cytokine Research. 2007;27(5):425–436. - PMC - PubMed
    1. Egger M, Pellett P, Nickl K, Geiger S, Graetz S, Seifert R, Heilmann J, Konig B. Synthesis and cannabinoid receptor activity of ketoalkenes from Echinacea pallida and nonnatural analogues. Chemistry. 2008;14(35):10978–10984. - PubMed
    1. Gertsch J, Schoop R, Kuenzle U, Suter A. Echinacea alkylamides modulate TNF-alpha gene expression via cannabinoid receptor CB2 and multiple signal transduction pathways. FEBS Lett. 2004;577(3):563–569. - PubMed
    1. Matthias A, Banbury L, Stevenson LM, Bone KM, Leach DN, Lehmann RP. Alkylamides from Echinacea modulate induced immune responses in macrophages. Immunol Invest. 2007;36(2):117–130. - PubMed

Publication types

MeSH terms