. 2011 Sep;23(9):2268-79.
doi: 10.1162/jocn.2010.21556. Epub 2010 Aug 3.

Perception of speech in noise: neural correlates

Affiliations

Perception of speech in noise: neural correlates

Judy H Song et al. J Cogn Neurosci. 2011 Sep.

Abstract

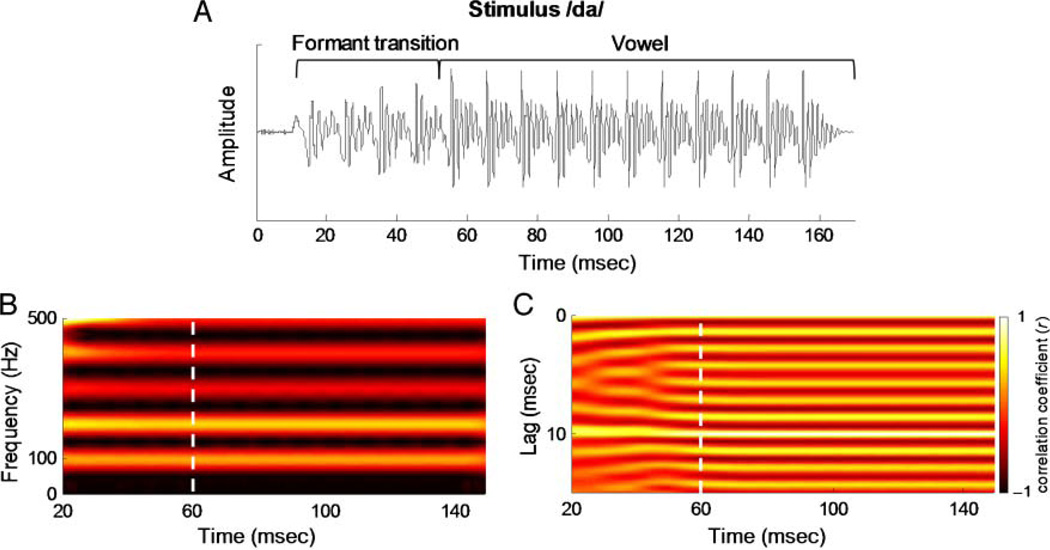
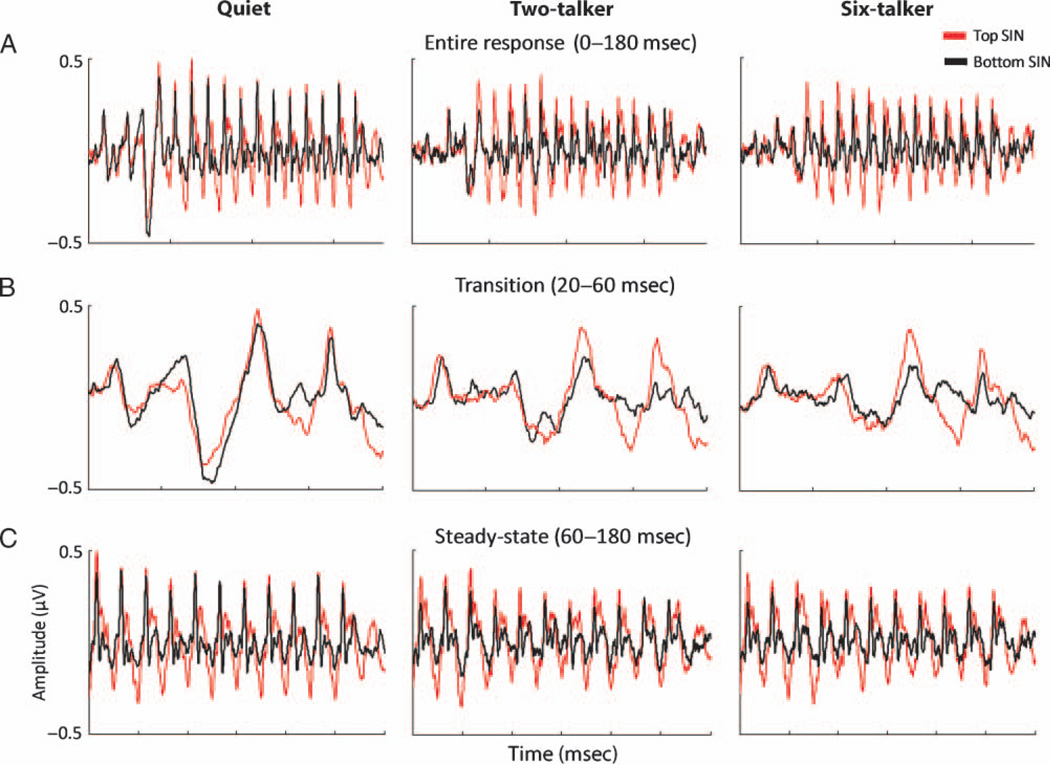
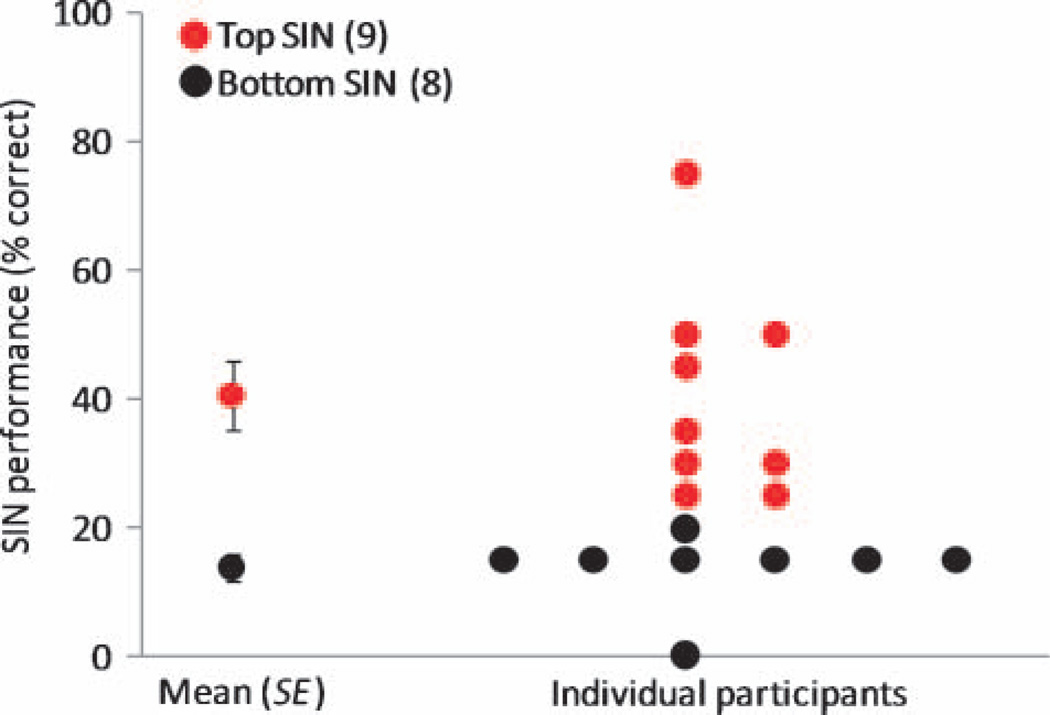
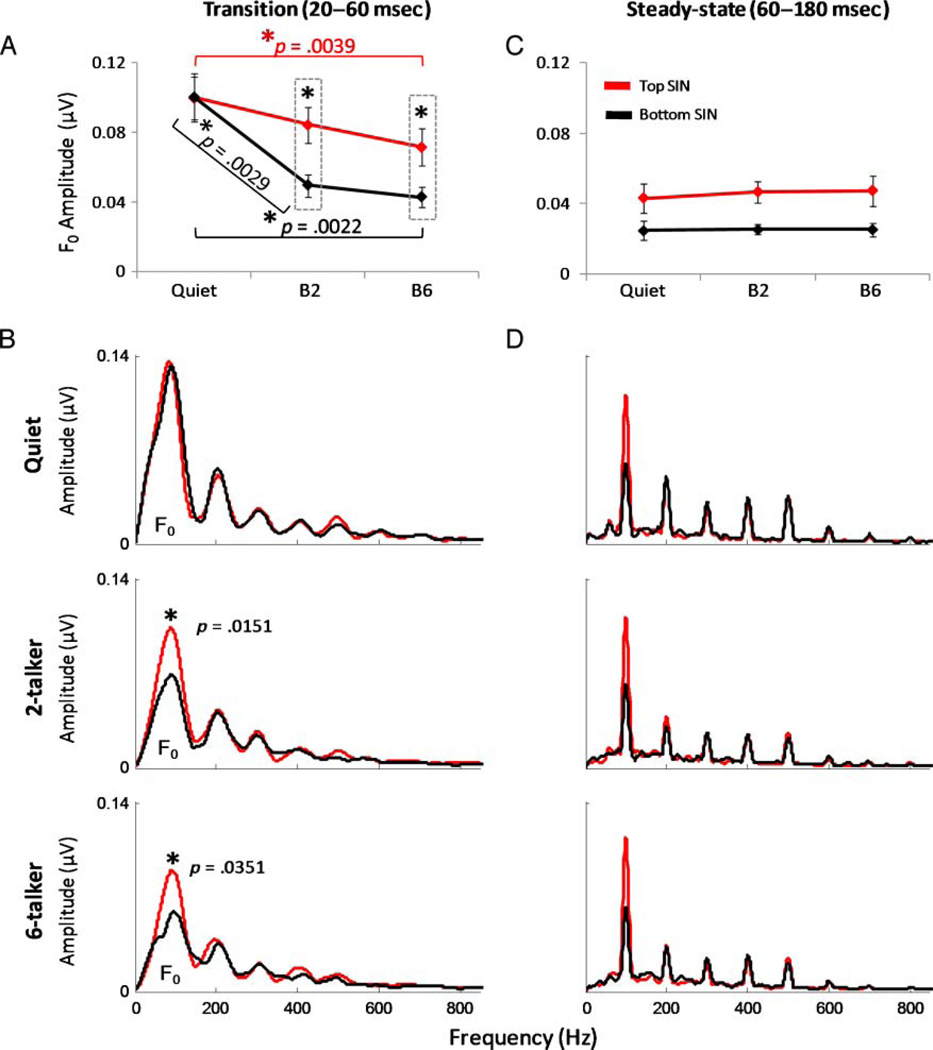
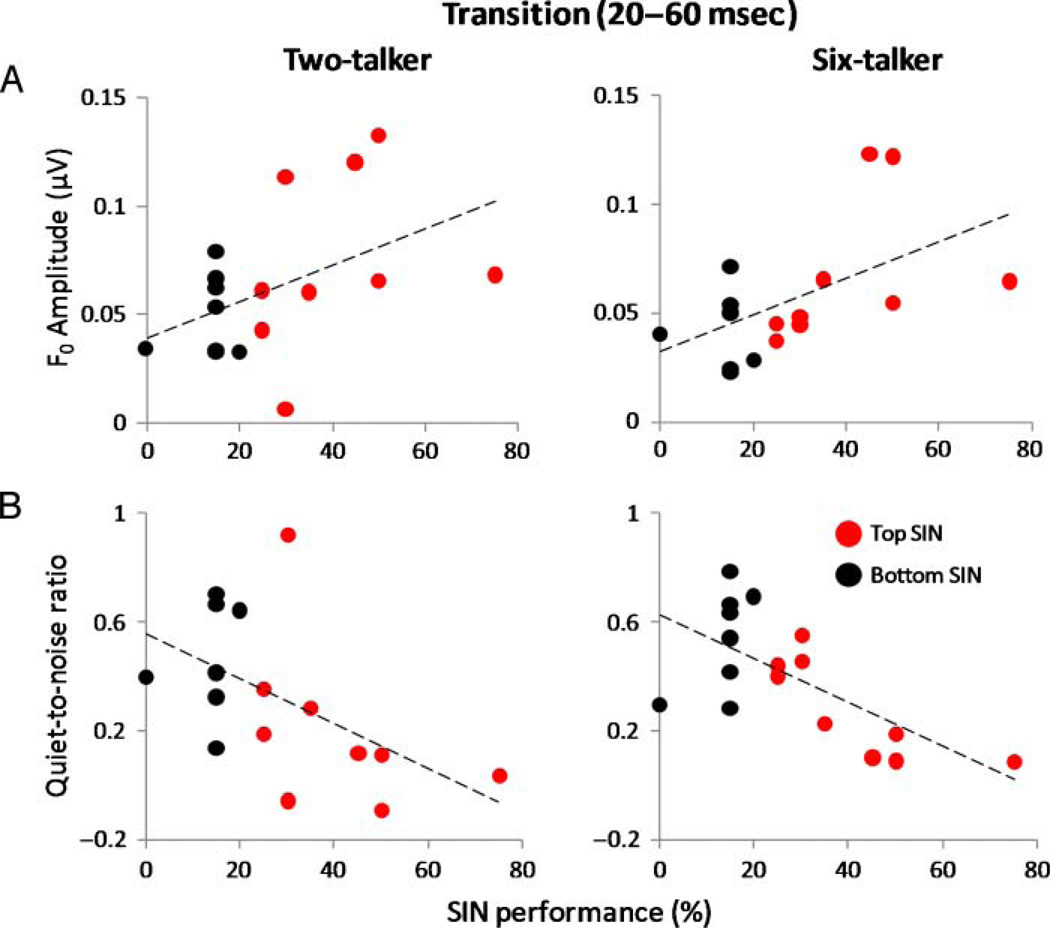
The presence of irrelevant auditory information (other talkers, environmental noises) presents a major challenge to listening to speech. The fundamental frequency (F(0)) of the target speaker is thought to provide an important cue for the extraction of the speaker's voice from background noise, but little is known about the relationship between speech-in-noise (SIN) perceptual ability and neural encoding of the F(0). Motivated by recent findings that music and language experience enhance brainstem representation of sound, we examined the hypothesis that brainstem encoding of the F(0) is diminished to a greater degree by background noise in people with poorer perceptual abilities in noise. To this end, we measured speech-evoked auditory brainstem responses to /da/ in quiet and two multitalker babble conditions (two-talker and six-talker) in native English-speaking young adults who ranged in their ability to perceive and recall SIN. Listeners who were poorer performers on a standardized SIN measure demonstrated greater susceptibility to the degradative effects of noise on the neural encoding of the F(0). Particularly diminished was their phase-locked activity to the fundamental frequency in the portion of the syllable known to be most vulnerable to perceptual disruption (i.e., the formant transition period). Our findings suggest that the subcortical representation of the F(0) in noise contributes to the perception of speech in noisy conditions.


Figures

Figure 1
Figure 1
Stimulus characteristics. (A) The acoustic waveform of the target stimulus /da/. The formant transition and the vowel regions are bracketed. The periodic amplitude modulations of the stimulus, reflecting the rate of the fundamental frequency, are represented by the major peaks in the stimulus waveform (10 msec apart). (B) The spectrogram illustrating the fundamental frequency and lower harmonics (stronger amplitudes represented with brighter colors) and (C) the autocorrelogram (a visual measure of response periodicity) of the stimulus /da/. The boundary of the consonant-vowel formant transition and the steady-state vowel portion of the syllable is marked by a dashed white line. Although the frequency and spectral amplitude of the F0 are constant as shown by the spectrogram, the interaction of the formants with the F0 in our stimulus resulted in weaker fundamental periodicity in the formant transition period (more diffuse colors). In contrast, the vowel is composed of unchanging formants, resulting in sustained and stronger F0 periodicity as shown by the autocorrelogram. These plots were generated via running window analysis over 40-msec bins starting at time 0, and the x axis refers to the midpoint of each bin (Song et al., 2008).
Figure 2
Figure 2
(A) Grand average brainstem responses of subjects with top (red) and bottom (black) SIN perception recorded to the /da/ stimulus without background noise (Quiet, left) and in two background noise conditions, two-talker (middle) and six-talker (right) babbles. (B) Overlay of top and bottom SIN groups’ transition (20–60 msec) and (C) steady-state response (60–180 msec) show that the top SIN group has better representation of the F0 in both background noise conditions as demonstrated by larger amplitudes of the prominent periodic peaks occurring every 10 msec. The transition portion of the response reflects the shift in formants as the stimulus moves from the onset burst to the vowel portion. The steady-state portion is a segment of the response that reflects phase locking to stimulus periodicity in the vowel.
Figure 3
Figure 3
Average score (±1 SE) and distribution of individual subject’s SIN performance (percent correct on QuickSIN). This measure was derived from the 0 dB SNR condition by dividing the number of correctly repeated target words from the final sentence of four randomly selected QuickSIN lists SNR. Subjects were categorized into top (≥25%, n = 9, red) and bottom (<25%, n = 8, black) SIN perceiving groups.
Figure 4
Figure 4
(A) Average fundamental frequency (F0) amplitude (100 Hz) of the transition response (20–60 msec) for the top (red) and bottom (black) SIN groups for each listening condition (±1 SE). (B) Grand average spectra of the transition response collected in quiet (top), two-talker (middle), and six-talker (bottom) noise for top and bottom SIN groups. For both noise conditions (B2 and B6), brainstem representation of the F0 was degraded to a greater extent in the bottom SIN group relative to the top SIN group (p = .0151 and .0351, respectively). (C) Average F0 amplitude of the steady-state portion (60–180 msec) for the top and bottom SIN groups for each listening condition (±1 SE). The effect sizes of the group differences were large in all three conditions (d = 0.99, 1.03, and 1.08 for quiet, two-talker, and six-talker noise conditions, respectively). The top SIN group demonstrated stronger F0 encoding in response to the sustained periodic vowel portion of the stimulus in all conditions. (D) Grand average spectra of the steady-state responses.
Figure 5
Figure 5
(A) Speech ABR F0 amplitude of the formant transition period obtained from two-talker (left) and six-talker (right) babble conditions as a function of SIN performance for each subject. Magnitude of the F0 correlated positively with SIN performance in the six-talker babble condition (rs = .523, p = .031) and approached significance in the two-talker babble condition (rs = .459, p = .064). (B) Normalized difference between quiet-to-noise F0 amplitude for two-talker (left) and six-talker (right) conditions (i.e., [F0(quiet) − F0(noise)] / F0(quiet)) as a function of SIN performance for each subject. Amplitude of the F0 for both conditions related to SIN performance (two-talker rs = −.47, p = .057 and six-talker rs = −.593, p = .012). The dashed horizontal lines depict the linear fit of the F0 amplitude and SIN measures.

Similar articles

Cited by

References

    1. Abrams DA, Nicol T, Zecker SG, Kraus N. Auditory brainstem timing predicts cerebral asymmetry for speech. Journal of Neuroscience. 2006;26:11131–11137. - PMC - PubMed
    1. Ahissar M, Hochstein S. The reverse hierarchy theory of visual perceptual learning. Trends in Cognitive Sciences. 2004;8:457–464. - PubMed
    1. Aiken SJ, Picton TW. Envelope and spectral frequency-following responses to vowel sounds. Hearing Research. 2008;245:35–47. - PubMed
    1. Akhoun I, Gallégo S, Moulin A, Menard M, Veuillet E, Berger-Vachon C, et al. The temporal relationship between speech auditory brainstem responses and the acoustic pattern of the phoneme /ba/ in normal-hearing adults. Clinical Neurophysiology. 2008;119:922–933. - PubMed
    1. Amitay S. Forward and reverse hierarchies in auditory perceptual learning. Learning & Perception. 2009;1:59–68.

Publication types