

Rational design, fabrication, characterization and in vitro testing of biodegradable microparticles that generate targeted and sustained transgene expression in HepG2 liver cells
- PMID: 20681752
- PMCID: PMC5258116
- DOI: 10.3109/1061186X.2010.504263
Rational design, fabrication, characterization and in vitro testing of biodegradable microparticles that generate targeted and sustained transgene expression in HepG2 liver cells
Abstract
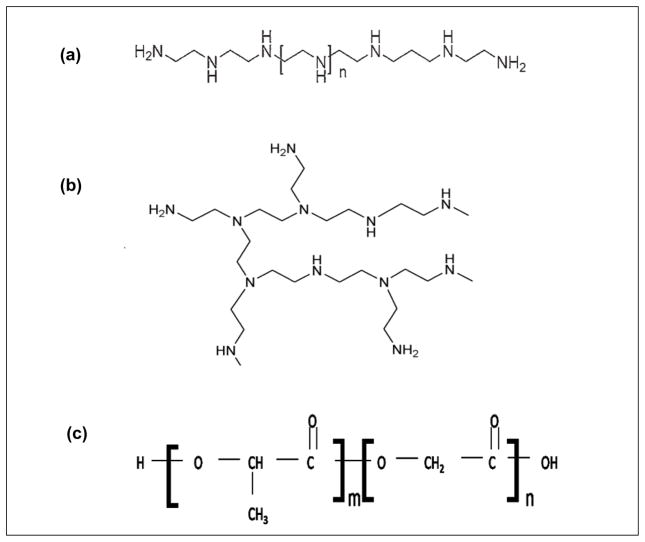
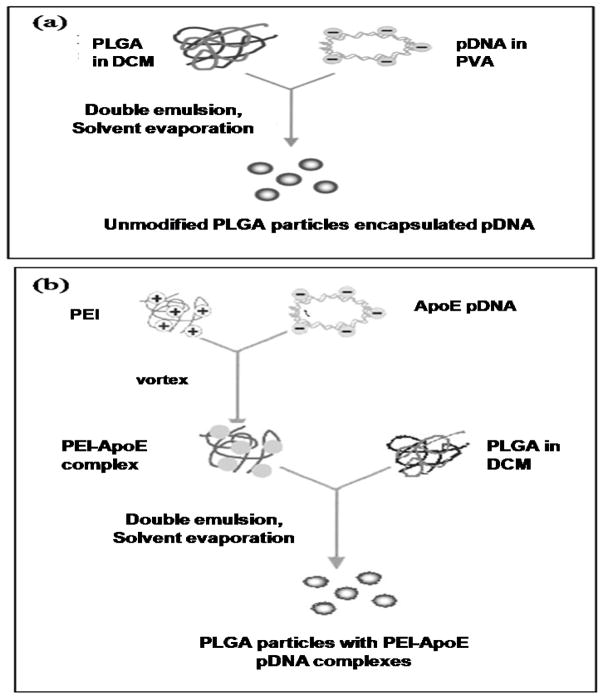
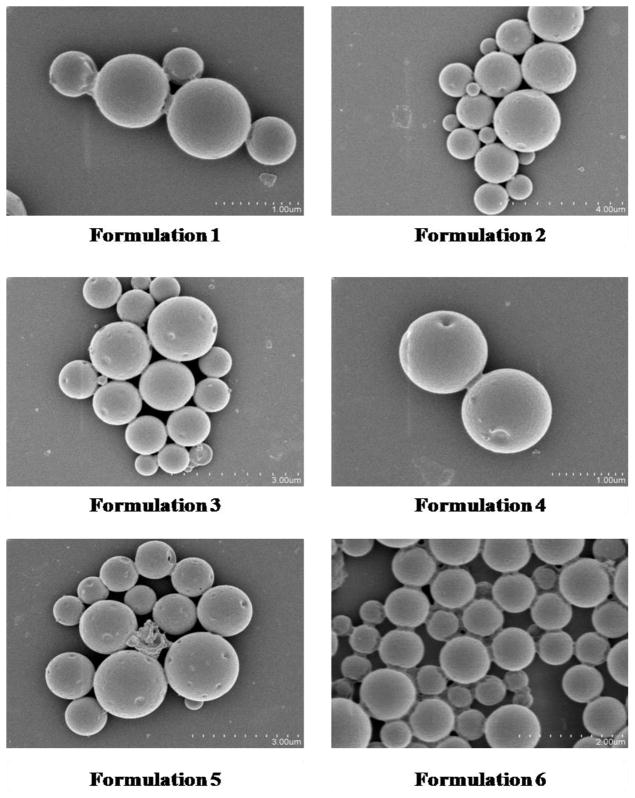
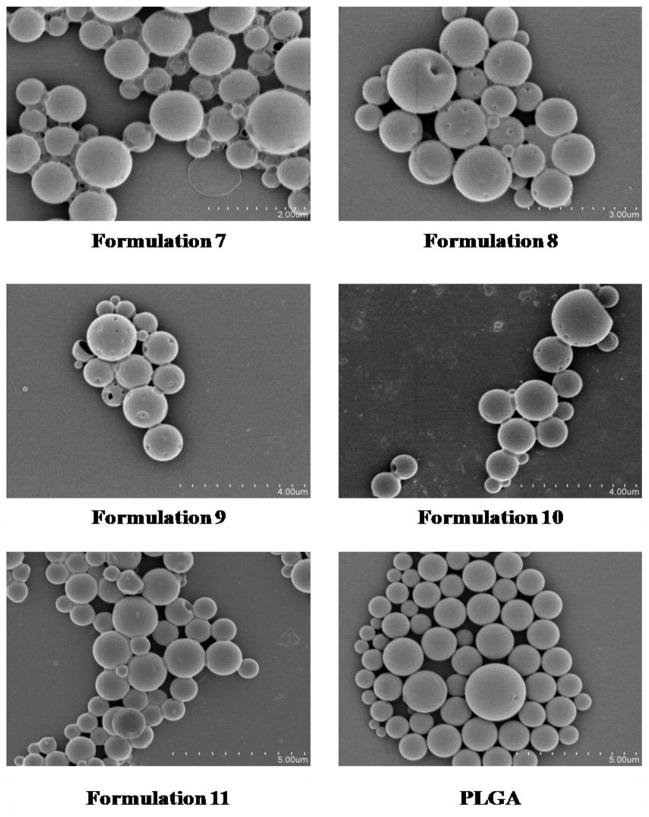
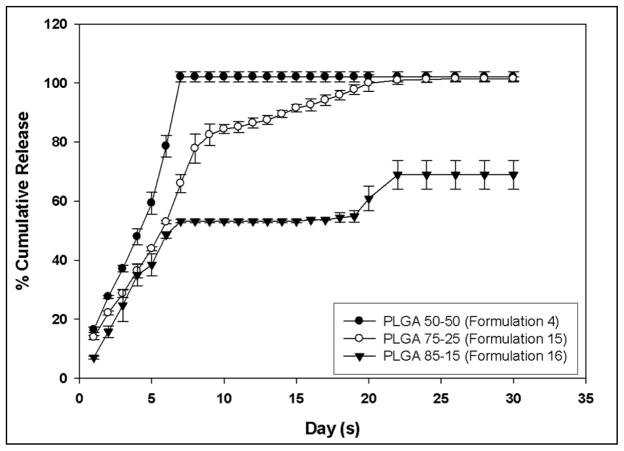
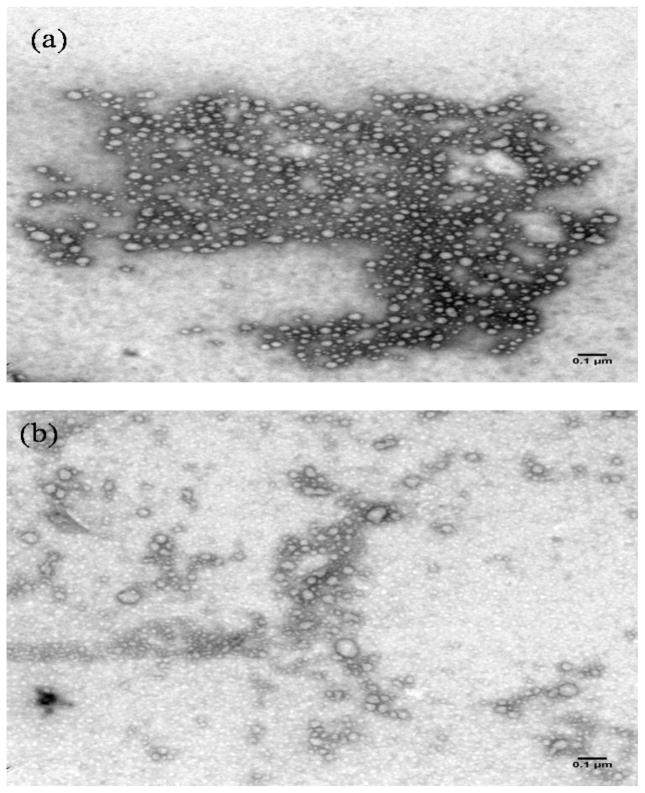
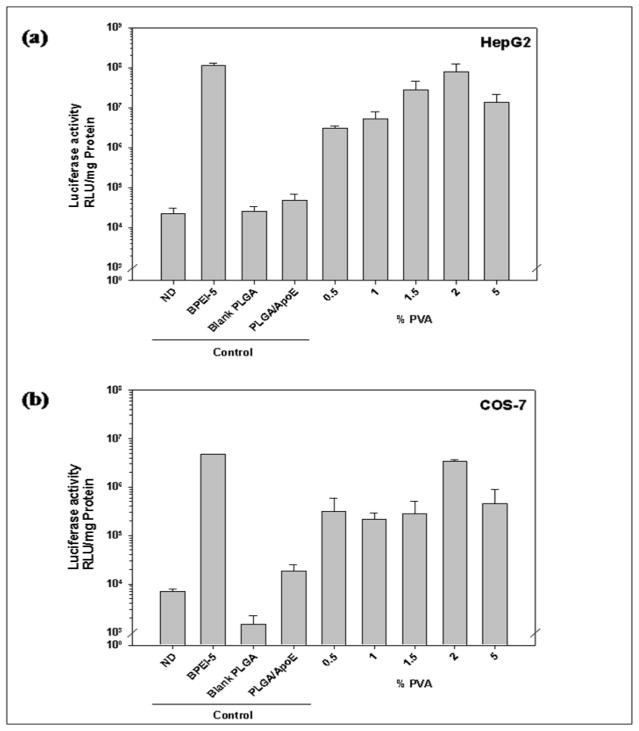
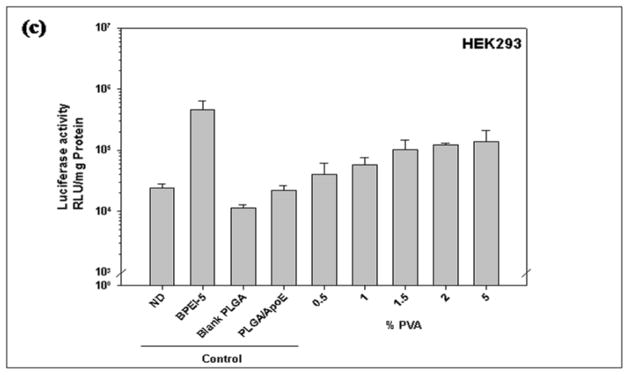
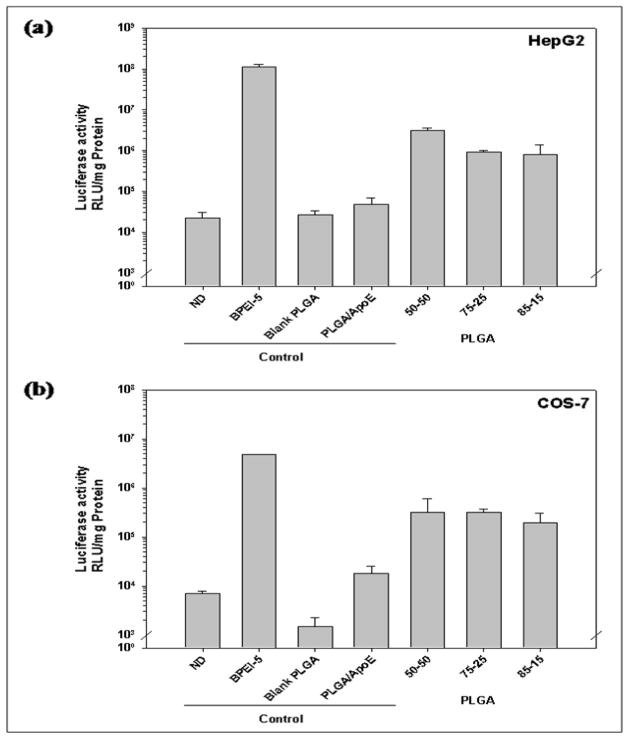
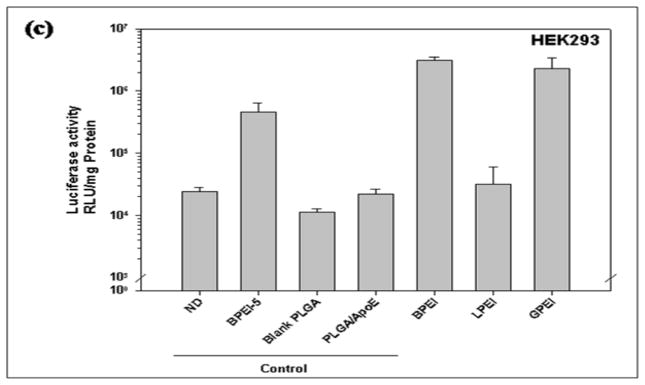
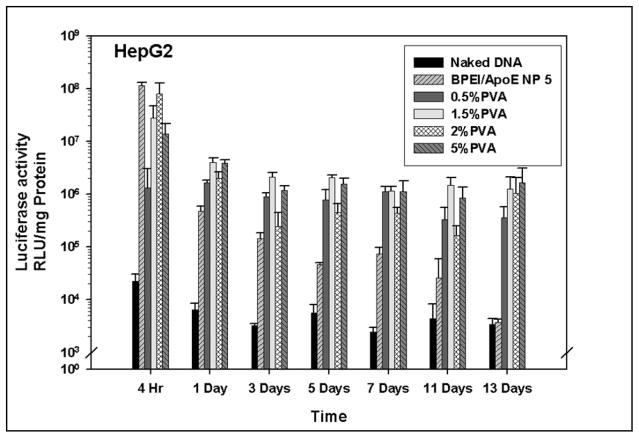
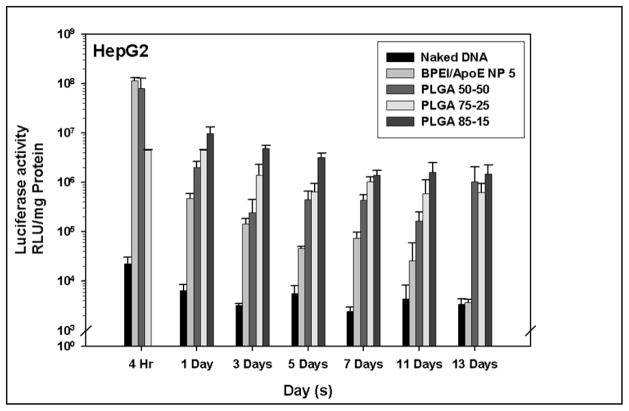
Poly(lactide-co-glycolide) (PLGA) microparticles have significant potential for sustained delivery of plasmid DNA (pDNA). However, unmodified PLGA microparticles have poor transfection efficiencies. In this study, we use several approaches to enhance the transfection efficiencies of PLGA microparticles in a HepG2 liver cell line. Polyethylenimine (PEI) is used to condense the pDNA prior to loading into the PLGA microparticles. This provides enhanced loading efficiencies and greater protection to the pDNA during the entrapment process. In addition, the pDNA used (ApoE) incorporates a hybrid liver-specific murine albumin enhancer/α1 antitrypsin promoter (AlbE/hAAT) to enhance transgene expression in human liver (HepG2) cells. The percentage of surfactant used in the preparation of the microparticles, the polymer composition of the PLGA, the ratio of the PEI to pDNA (N/P), the structure of the PEI and the potential utility of a galactose targeting ligand were then investigated to further optimize the efficacy of the cationic microparticle non-viral delivery system in transfecting HepG2 cells. For each PLGA PEI-pDNA microparticle formulation prepared, we evaluated particle size, ζ-potential, loading of pDNA, cytotoxicity, and transgene expression in HepG2 cells and control human embryonic kidney (HEK293) and monkey African green kidney fibroblast-like (COS7) cells. Loading PLGA particles with PEI-ApoE pDNA complexes resulted in a significant reduction in particle size when compared to PLGA microparticles loaded with ApoE pDNA alone. Scanning electron microscopy images showed that all the particle formulations were smooth and spherical in appearance. Incorporation of the cationic PEI in the PLGA particles changed the ζ-potential from negative to positive. Complexing PEI with ApoE pDNA increased the loading efficiency of the ApoE pDNA into the PLGA microparticles. The cytotoxicity of PLGA particles loaded with PEI-ApoE pDNA complexes was similar to PLGA particles loaded with ApoE pDNA alone. The transfection efficiency of all particle formulations prepared with ApoE pDNA was significantly higher in HepG2 cells when compared to HEK293 and COS7 cell lines. The release of PEI-pDNA complexes from particles prepared with different PLGA polymer compositions including PLGA 50-50, PLGA 75-25, and PLGA 85-15 was sustained in all cases but the release profile was dependent on the polymer composition. Transmission electron microscopy images showed that PEI-pDNA complexes remained structurally intact after release. The optimum formulation for PLGA particles loaded with PEI-ApoE pDNA complexes was prepared using 2% polyvinyl alcohol, 50-50 PLGA compositions and N/P ratios of 5-10. Strong sustained transgene expression in HepG2 cells was generated by PLGA PEI-ApoE pDNA particles up to the full 13 days tested.
Figures


Similar articles
-
Fabrication, characterization and in vitro evaluation of poly(D,L-lactide-co-glycolide) microparticles loaded with polyamidoamine-plasmid DNA dendriplexes for applications in nonviral gene delivery.J Pharm Sci. 2010 Jan;99(1):368-84. doi: 10.1002/jps.21840. J Pharm Sci. 2010. PMID: 19670295 Free PMC article.
-
Comparative study of poly (lactic-co-glycolic acid)-poly ethyleneimine-plasmid DNA microparticles prepared using double emulsion methods.J Microencapsul. 2008 Feb;25(1):1-12. doi: 10.1080/02652040701659347. J Microencapsul. 2008. PMID: 18188727
-
Chitosan-modified poly(D,L-lactide-co-glycolide) nanospheres for plasmid DNA delivery and HBV gene-silencing.Int J Pharm. 2011 Aug 30;415(1-2):259-66. doi: 10.1016/j.ijpharm.2011.05.053. Epub 2011 May 27. Int J Pharm. 2011. PMID: 21645597
-
[Advance in the study of poly(lactide-co-glycolide) nano/microparticles as gene vector].Yao Xue Xue Bao. 2010 Nov;45(11):1346-53. Yao Xue Xue Bao. 2010. PMID: 21361033 Review. Chinese.
-
Formulating poly(lactide-co-glycolide) particles for plasmid DNA delivery.J Pharm Sci. 2008 Jul;97(7):2448-61. doi: 10.1002/jps.21215. J Pharm Sci. 2008. PMID: 17918737 Review.
Cited by
-
Biomaterial-based delivery systems of nucleic acid for regenerative research and regenerative therapy.Regen Ther. 2019 Jul 11;11:123-130. doi: 10.1016/j.reth.2019.06.007. eCollection 2019 Dec. Regen Ther. 2019. PMID: 31338391 Free PMC article. Review.
-
A Pilot Study Evaluating Combinatorial and Simultaneous Delivery of Polyethylenimine-Plasmid DNA Complexes Encoding for VEGF and PDGF for Bone Regeneration in Calvarial Bone Defects.Curr Pharm Biotechnol. 2015;16(7):655-60. doi: 10.2174/138920101607150427112753. Curr Pharm Biotechnol. 2015. PMID: 25934975 Free PMC article.
-
Nanoparticle-Based Delivery of CRISPR/Cas9 Genome-Editing Therapeutics.AAPS J. 2018 Oct 10;20(6):108. doi: 10.1208/s12248-018-0267-9. AAPS J. 2018. PMID: 30306365 Free PMC article. Review.
-
Biodegradable particles as vaccine antigen delivery systems for stimulating cellular immune responses.Hum Vaccin Immunother. 2013 Dec;9(12):2584-90. doi: 10.4161/hv.26136. Epub 2013 Aug 26. Hum Vaccin Immunother. 2013. PMID: 23978910 Free PMC article. Review.
-
Optimized dextran-polyethylenimine conjugates are efficient non-viral vectors with reduced cytotoxicity when used in serum containing environments.Int J Pharm. 2012 May 1;427(1):71-9. doi: 10.1016/j.ijpharm.2011.10.032. Epub 2011 Oct 21. Int J Pharm. 2012. PMID: 22037445 Free PMC article.
References
-
- Salem AK, Searson PC, Leong KW. Multifunctional nanorods for gene delivery. Nature Materials. 2003;2(10):668–671. - PubMed
-
- Abbas AO, Donovan MD, Salem AK. Formulating poly(lactide-co-glycolide) particles for plasmid DNA delivery. Journal of Pharmaceutical Sciences. 2008;97(7):2448–2461. - PubMed
-
- Sun X, et al. Targeted gene delivery to hepatoma cells using galactosylated liposome-polycation-DNA complexes (LPD) Journal of Drug Targeting. 2005;13(2):121–128. - PubMed
-
- Wang SL, et al. Design and synthesis of novel galactosylated polymers for liposomes as gene drug carriers targeting the hepatic asialoglycoprotein receptor. Journal of Drug Targeting. 2008;16(3):233–242. - PubMed
Publication types
MeSH terms
Substances
Grants and funding
LinkOut - more resources
Full Text Sources
Other Literature Sources
Miscellaneous