An orthotopic lung tumor model for image-guided microirradiation in rats
- PMID: 20681800
- PMCID: PMC2917257
- DOI: 10.1667/RR2157.1
An orthotopic lung tumor model for image-guided microirradiation in rats
Abstract
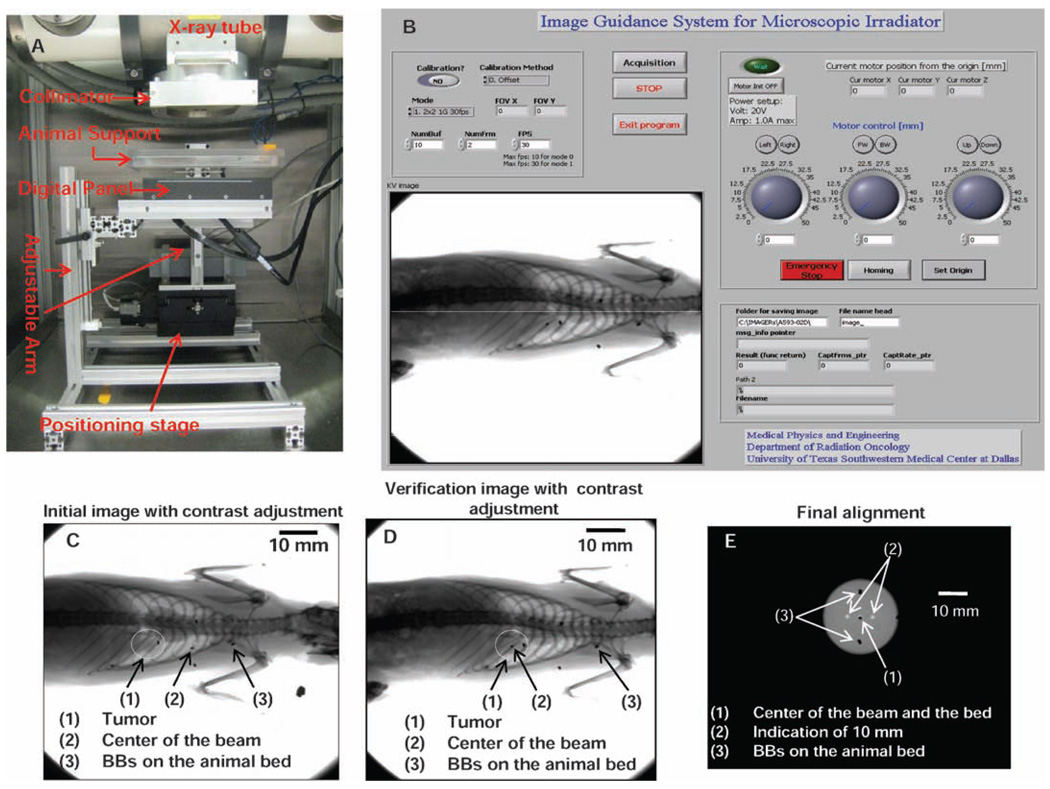
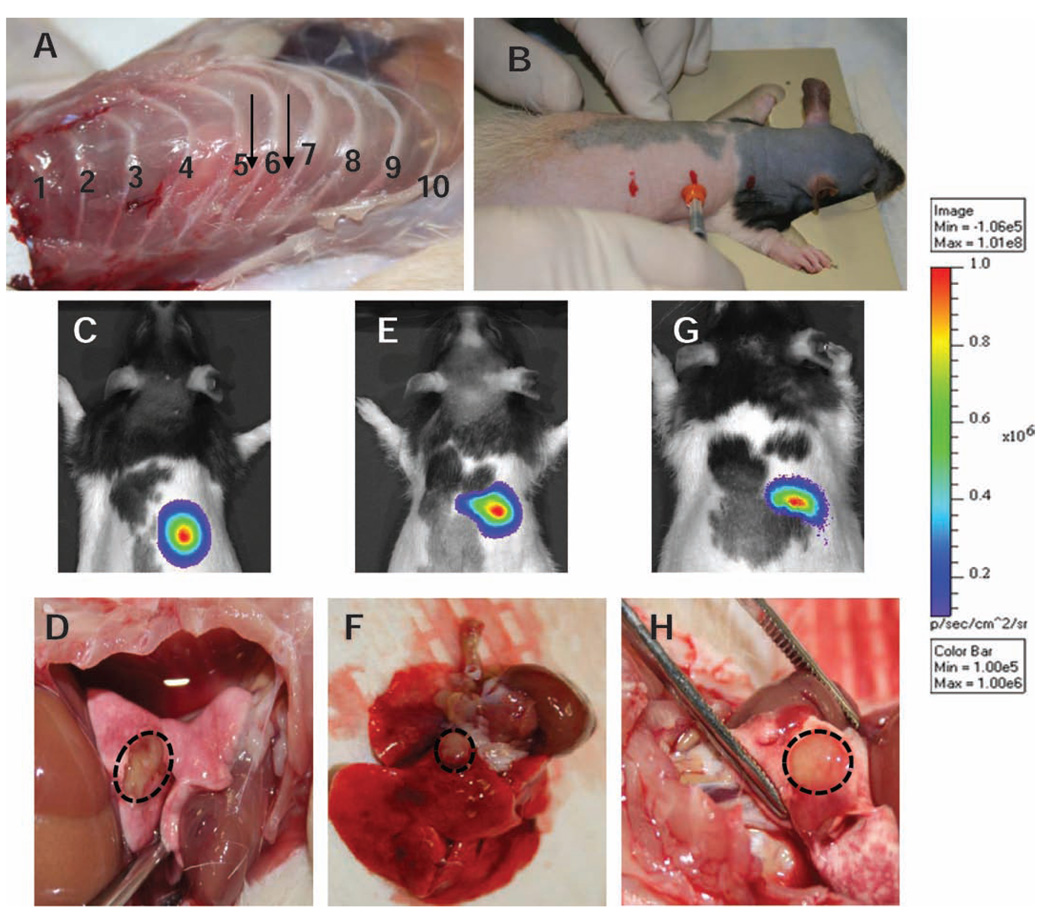
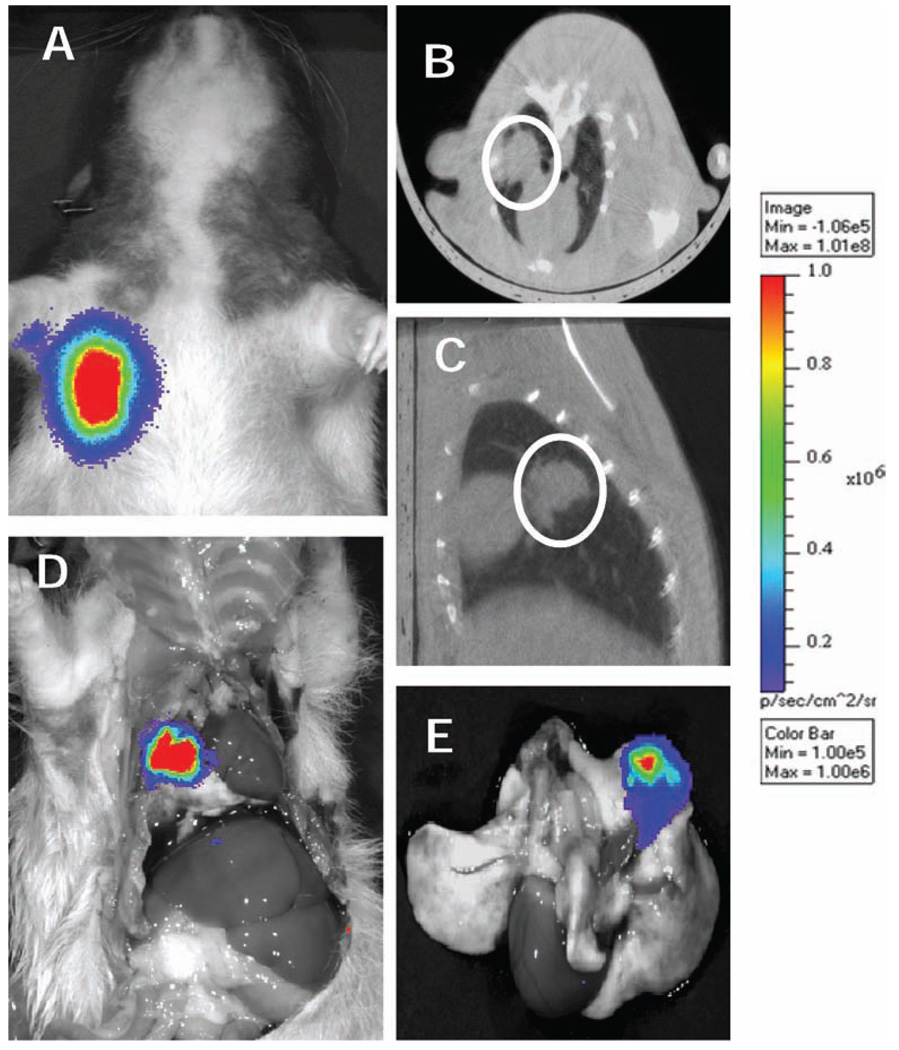
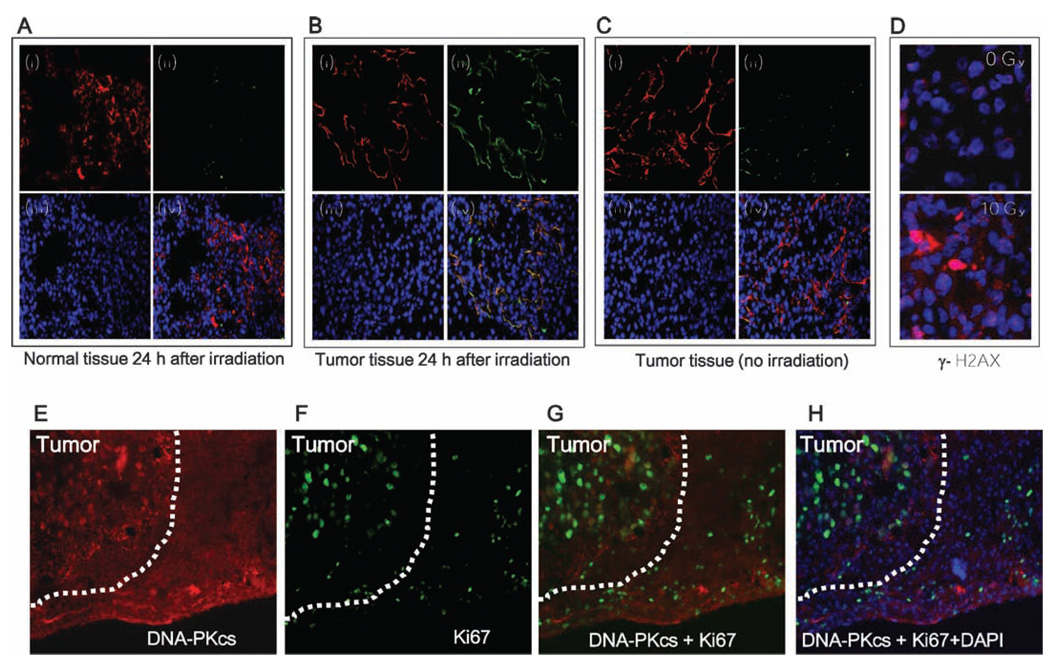
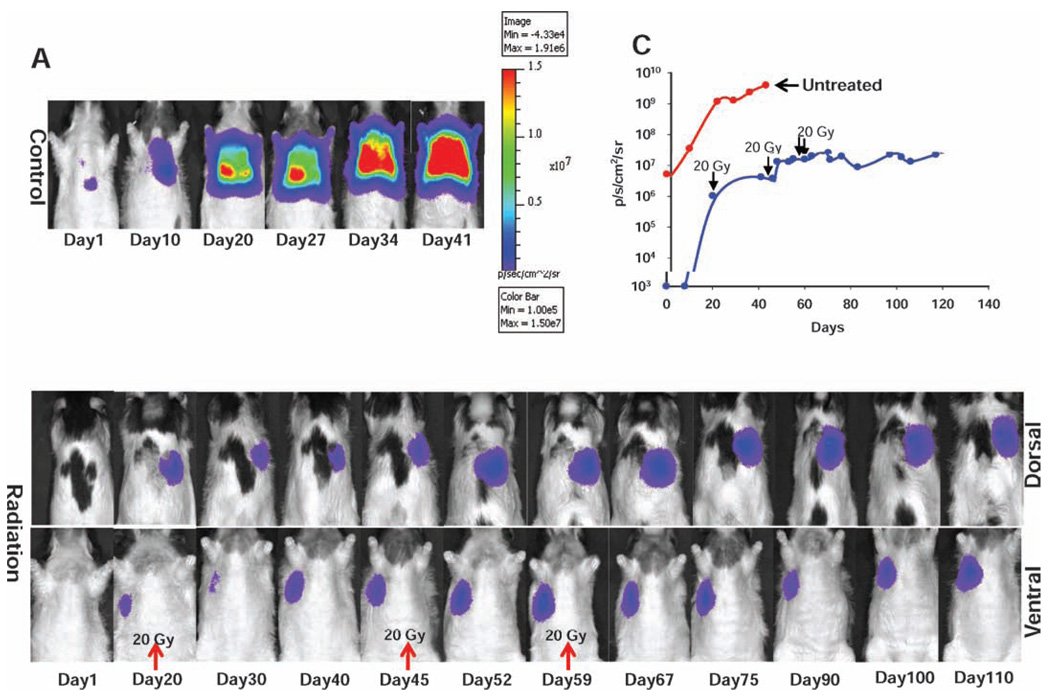
The purpose of this study was to develop a rat orthotopic lung tumor model with a solitary intrapulmonary nodule to study the effects of high-dose radiation. A549-Luc non-small cell lung cancer (NSCLC) cells were implanted into nude rats in the intercostal space between ribs 5 and 6 of the right lung. Bioluminescence and microcomputed tomography (CT) imaging were performed after implantation to confirm the presence of a solitary tumor and to monitor tumor growth. A device using image guidance for localization was developed to facilitate high-precision irradiation in small animals. A pilot irradiation study was performed, and response was assessed by bioluminescence imaging and immunohistochemistry. Radiation response was confirmed through serial bioluminescence imaging, and the strength of the bioluminescence signal was observed to be inversely proportional to dose. Response was also observed by the monoclonal antibody bavituximab, which binds to exposed lipid phosphatidylserine (PS) on tumor vessels. The ability to (1) reproducibly generate solitary tumor nodules in the rat lung, (2) identify and monitor tumor growth by bioluminescence imaging and CT imaging, (3) accurately target these tumors using high doses of radiation, and (4) demonstrate and quantify radiation response using bioluminescence imaging provides significant opportunity to probe the biological mechanisms of high-dose irradiation in preclinical settings.
Figures
Similar articles
-
Effective Rat Lung Tumor Model for Stereotactic Body Radiation Therapy.Radiat Res. 2016 Jun;185(6):616-22. doi: 10.1667/RR14382.1. Epub 2016 May 25. Radiat Res. 2016. PMID: 27223828 Free PMC article.
-
A Multimodality Image Guided Precision Radiation Research Platform: Integrating X-ray, Bioluminescence, and Fluorescence Tomography With Radiation Therapy.Int J Radiat Oncol Biol Phys. 2020 Nov 15;108(4):1063-1072. doi: 10.1016/j.ijrobp.2020.06.023. Epub 2020 Jun 22. Int J Radiat Oncol Biol Phys. 2020. PMID: 32585336
-
How to establish a solitary and localized VX2 lung cancer rabbit model? A simple and effective intrapulmonary tumor implantation technique.J Surg Res. 2009 Jun 15;154(2):284-92. doi: 10.1016/j.jss.2008.06.019. Epub 2008 Jul 15. J Surg Res. 2009. PMID: 18755479
-
Orthotopic lung cancer murine model by nonoperative transbronchial approach.Ann Thorac Surg. 2014 May;97(5):1771-5. doi: 10.1016/j.athoracsur.2014.01.048. Ann Thorac Surg. 2014. PMID: 24792261
-
Model for mediastinal lymph node metastasis produced by orthotopic intrapulmonary implantation of lung cancer cells in mice.Hum Cell. 1999 Dec;12(4):197-204. Hum Cell. 1999. PMID: 10834106 Review.
Cited by
-
Effective Rat Lung Tumor Model for Stereotactic Body Radiation Therapy.Radiat Res. 2016 Jun;185(6):616-22. doi: 10.1667/RR14382.1. Epub 2016 May 25. Radiat Res. 2016. PMID: 27223828 Free PMC article.
-
An athymic rat model of cutaneous radiation injury designed to study human tissue-based wound therapy.Radiat Oncol. 2012 May 8;7:68. doi: 10.1186/1748-717X-7-68. Radiat Oncol. 2012. PMID: 22568958 Free PMC article.
-
SapC-DOPS as a Novel Therapeutic and Diagnostic Agent for Glioblastoma Therapy and Detection: Alternative to Old Drugs and Agents.Pharmaceuticals (Basel). 2021 Nov 20;14(11):1193. doi: 10.3390/ph14111193. Pharmaceuticals (Basel). 2021. PMID: 34832975 Free PMC article. Review.
-
Response to stereotactic ablative radiotherapy in a novel orthotopic model of non-small cell lung cancer.Oncotarget. 2017 Nov 28;9(2):1630-1640. doi: 10.18632/oncotarget.22727. eCollection 2018 Jan 5. Oncotarget. 2017. PMID: 29416719 Free PMC article.
-
Validation of an orthotopic non-small cell lung cancer mouse model, with left or right tumor growths, to use in conformal radiotherapy studies.PLoS One. 2023 Apr 13;18(4):e0284282. doi: 10.1371/journal.pone.0284282. eCollection 2023. PLoS One. 2023. PMID: 37053154 Free PMC article.
References
-
- Ries LAG, Melbert D, Krapcho M, Stinchcomb DG, Howlader N, Horner MJ, Mariotto A, Miller BA, Feuer EJ, Edwards BK, editors. SEER Cancer Statistics Review, 1975–2005. Bethesda, MD: National Cancer Institute; 2008. http://seer.cancer.gov/csr/1975_2005/, based on November 2007 SEER data submission, posted to the SEER website.
-
- Flehinger BJ, Kimmel M, Melamed MR. The effect of surgical treatment on survival from early lung cancer. Implications for screening. Chest. 1992;101:1013–1018. - PubMed
-
- Gale NW, Yancopoulos GD. Growth factors acting via endothelial cell-specific receptor tyrosine kinases: VEGFs, angiopoietins, and ephrins in vascular development. Genes Dev. 1999;13:1055–1066. - PubMed
-
- Armstrong JG, Minsky BD. Radiation therapy for medically inoperable stage I and II non-small cell lung cancer. Cancer Treat. Rev. 1989;16:247–255. - PubMed
-
- Coy P, Kennelly GM. The role of curative radiotherapy in the treatment of lung cancer. Cancer. 1980;45:698–702. - PubMed
Publication types
MeSH terms
Grants and funding
LinkOut - more resources
Full Text Sources
Other Literature Sources
Medical