. 2010 Nov;34(11):1937-47.
doi: 10.1111/j.1530-0277.2010.01283.x.

¹H and ³¹P NMR lipidome of ethanol-induced fatty liver

Affiliations

¹H and ³¹P NMR lipidome of ethanol-induced fatty liver

Harshica Fernando et al. Alcohol Clin Exp Res. 2010 Nov.

Abstract

Background: Hepatic steatosis (fatty liver), an early and reversible stage of alcoholic liver disease, is characterized by triglyceride deposition in hepatocytes, which can advance to steatohepatitis, fibrosis, cirrhosis, and ultimately to hepatocellular carcinoma. In the present work, we studied altered plasma and hepatic lipid metabolome (lipidome) to understand the mechanisms and lipid pattern of early-stage alcohol-induced-fatty liver.

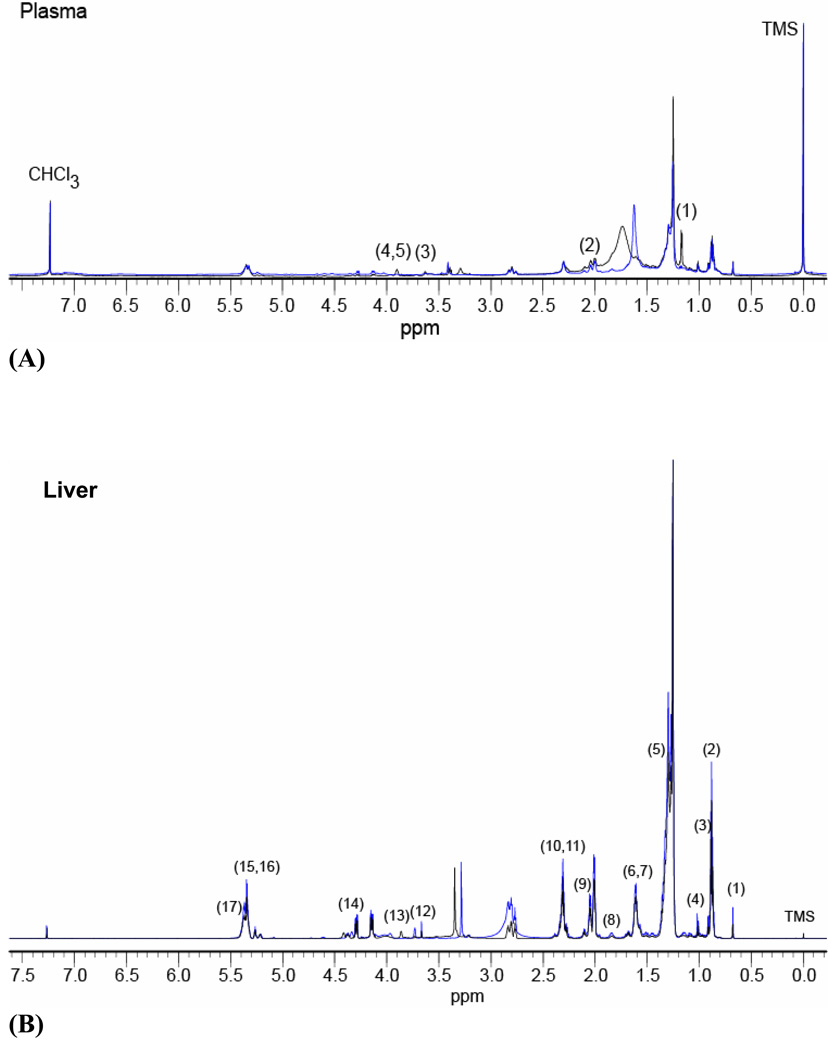
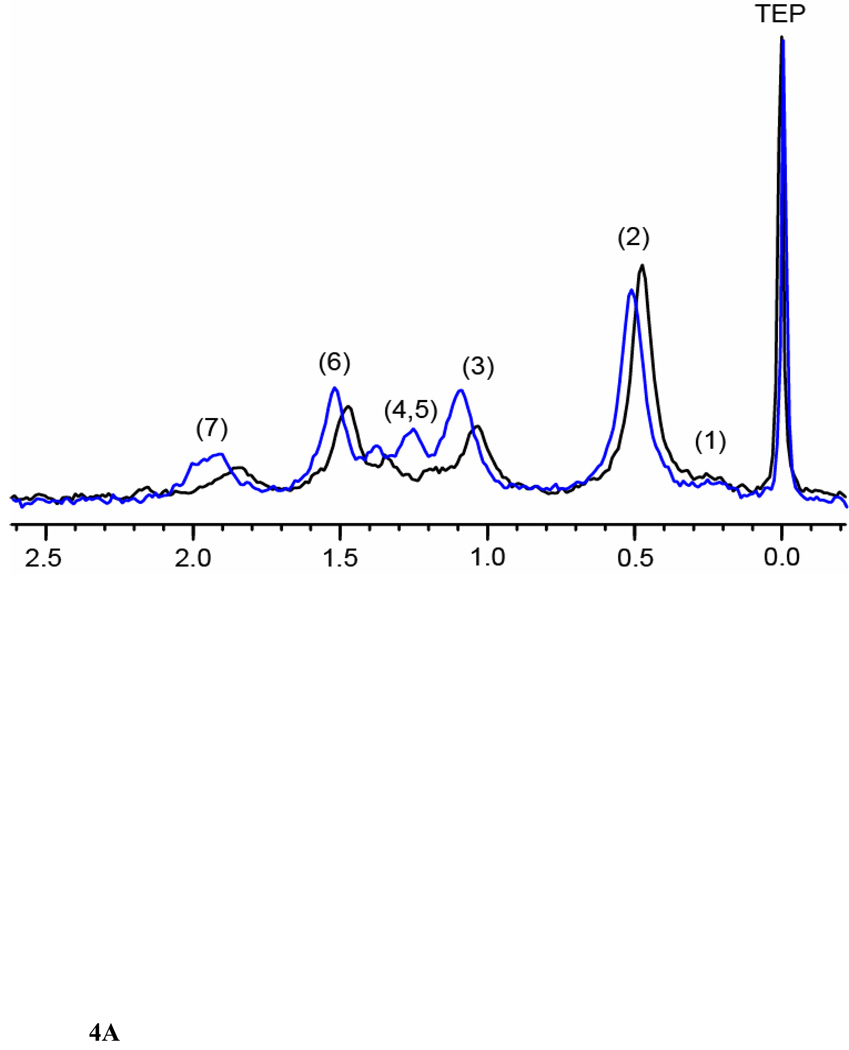
Methods: Male Fischer 344 rats were fed 5% alcohol in a Lieber-DeCarli diet. Control rats were pair-fed an equivalent amount of maltose-dextrin. After 1 month, animals were killed and plasma collected. Livers were excised for morphological, immunohistochemical, and biochemical studies. The lipids from plasma and livers were extracted with methyl-tert-butyl ether and analyzed by 750/800 MHz proton nuclear magnetic resonance (¹H NMR) and phosphorus (³¹P) NMR spectroscopy on a 600 MHz spectrometer. The NMR data were then subjected to multivariate statistical analysis.

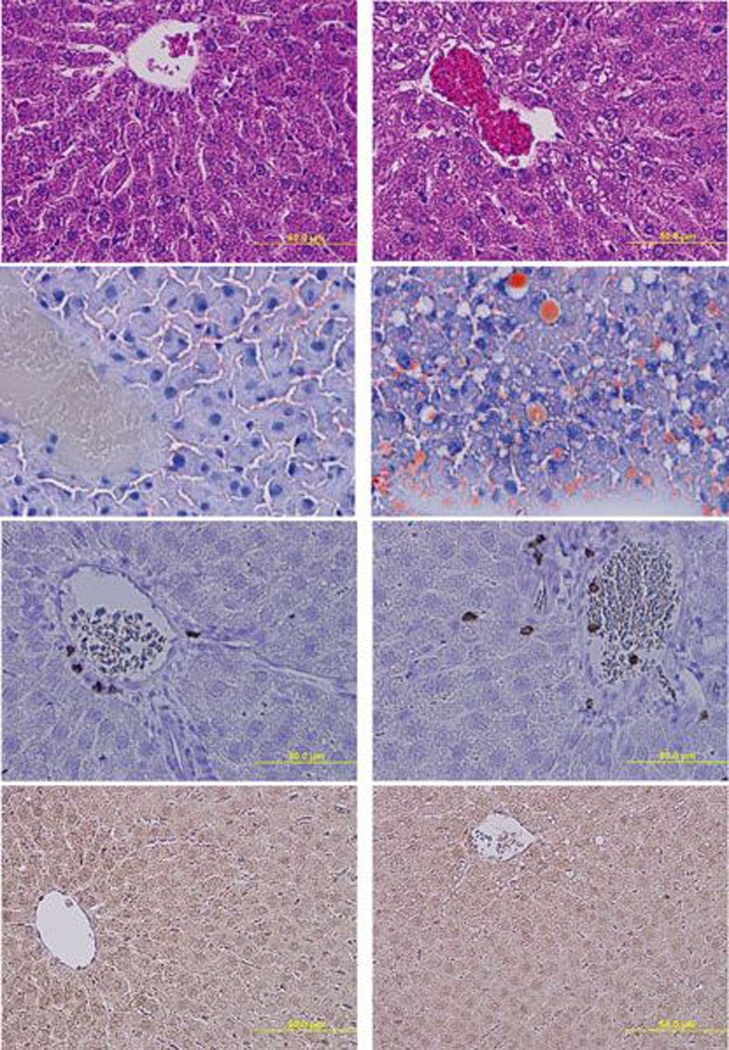
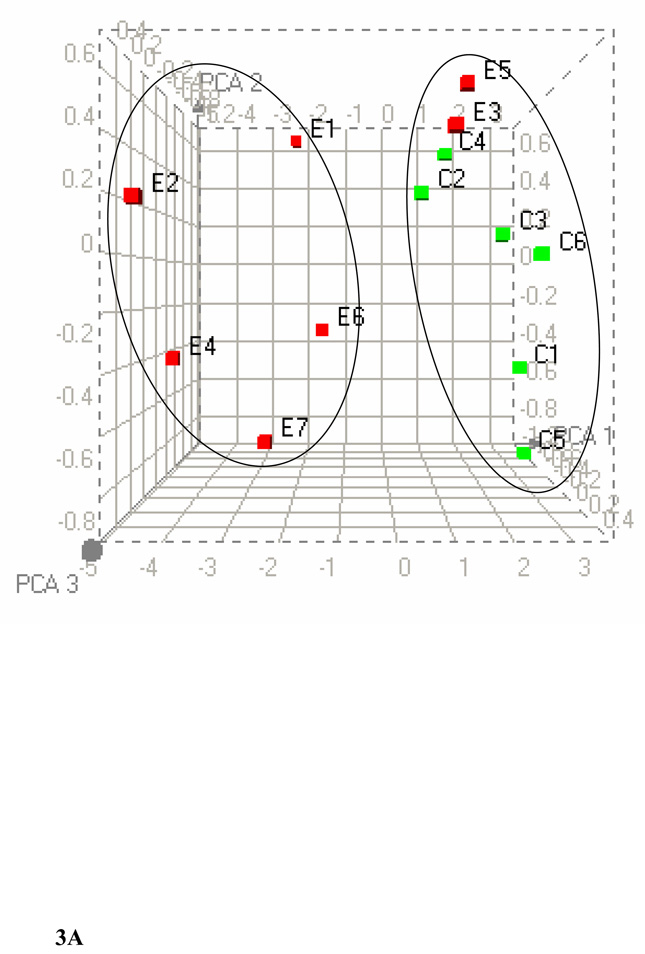
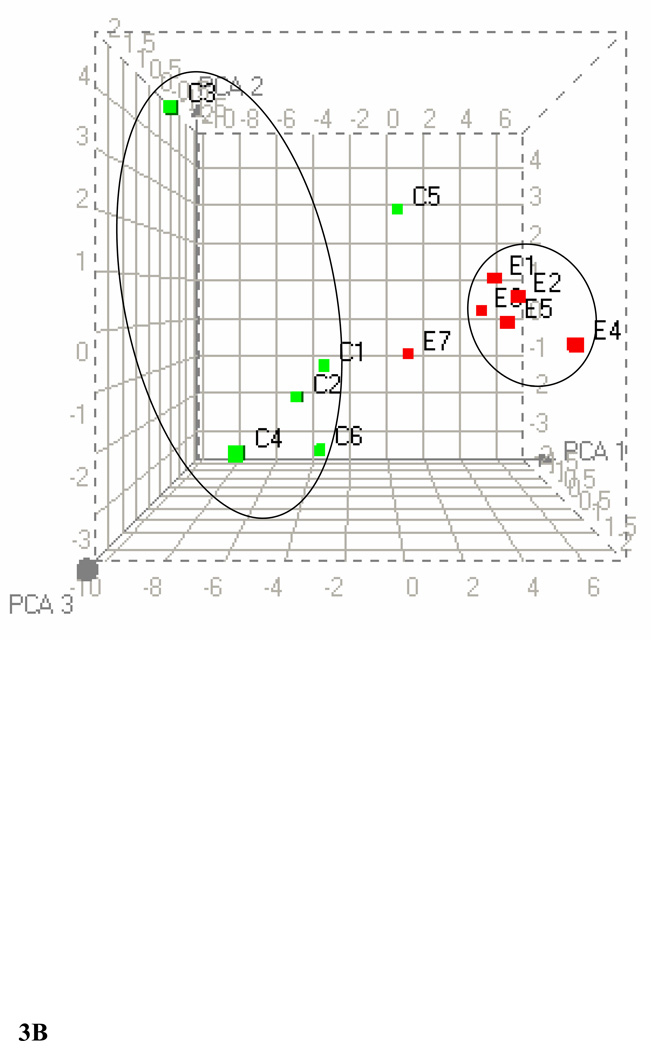
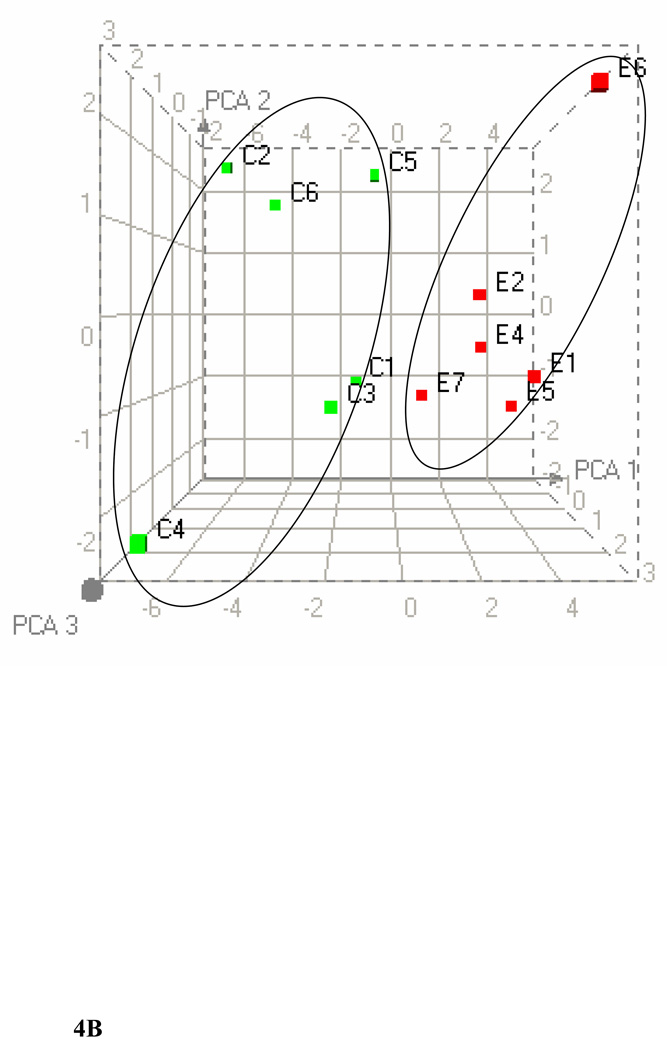
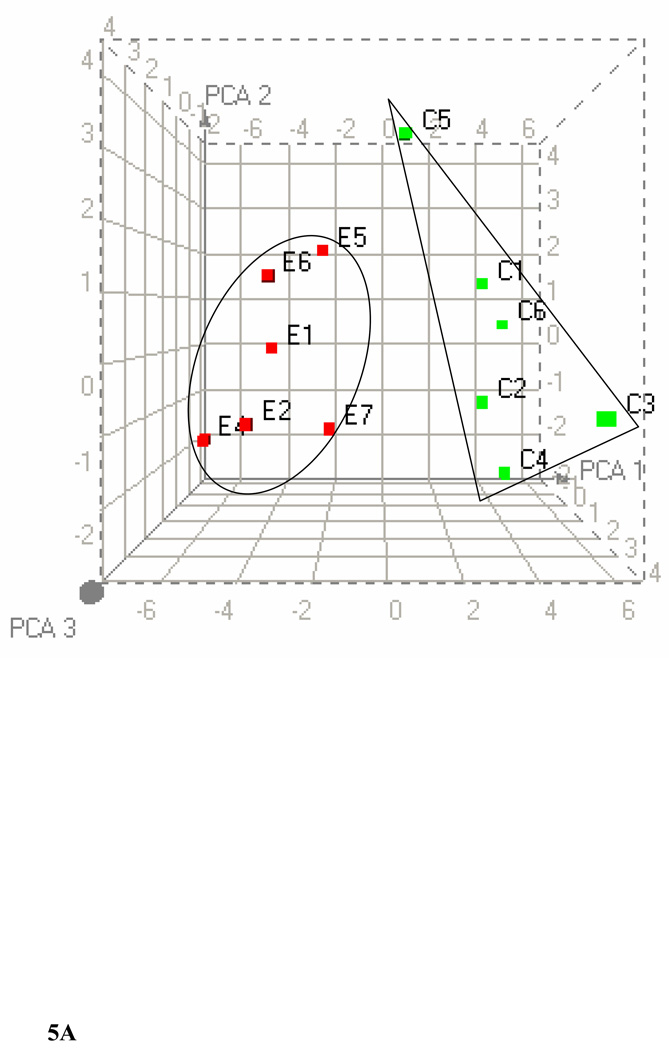
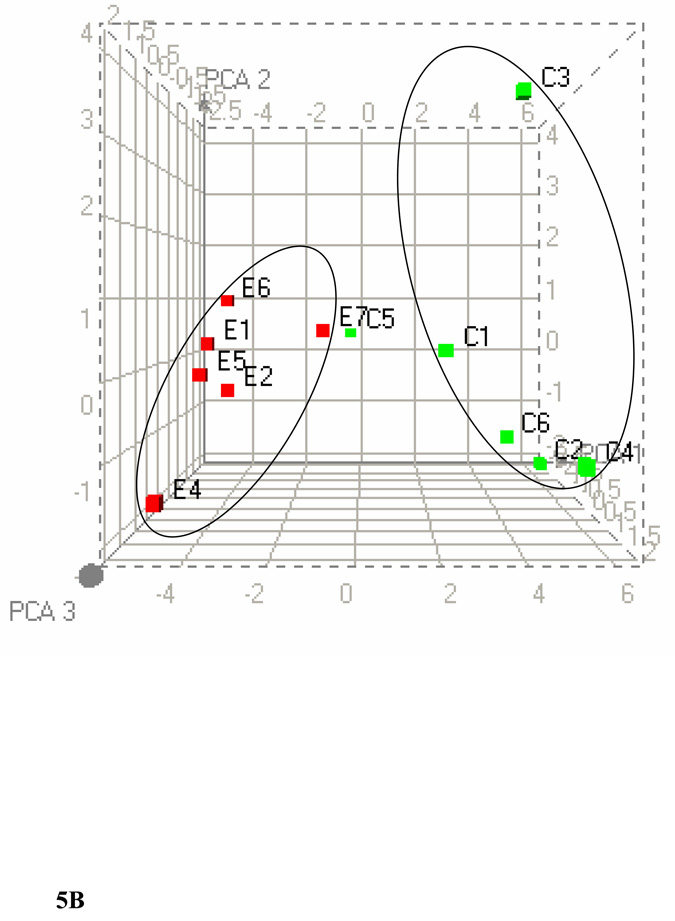
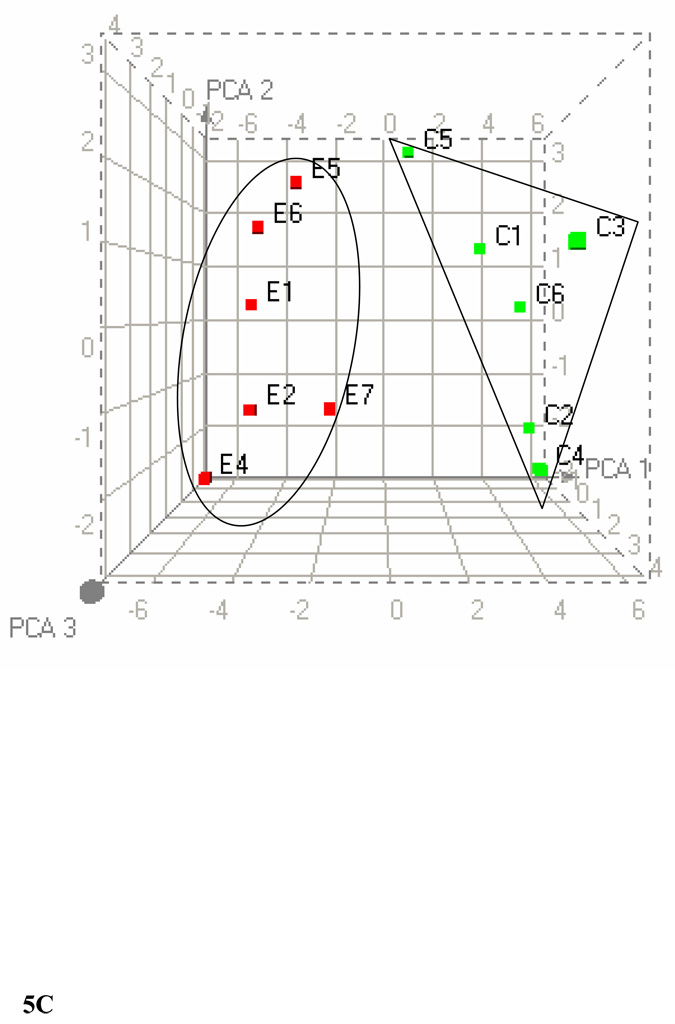
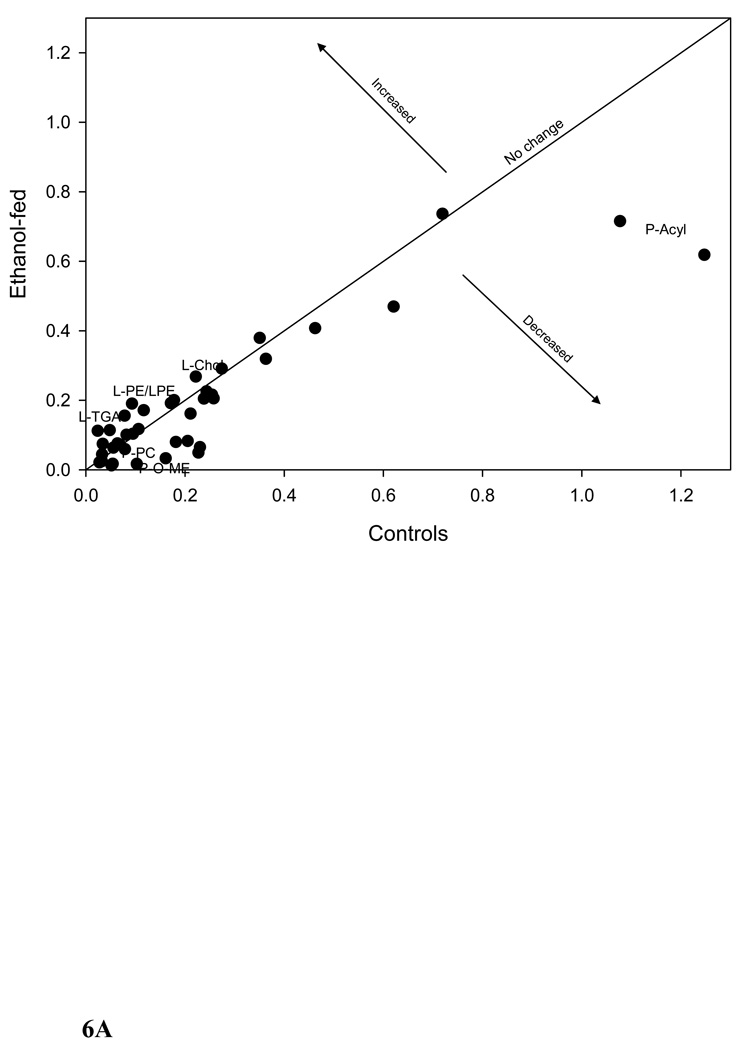
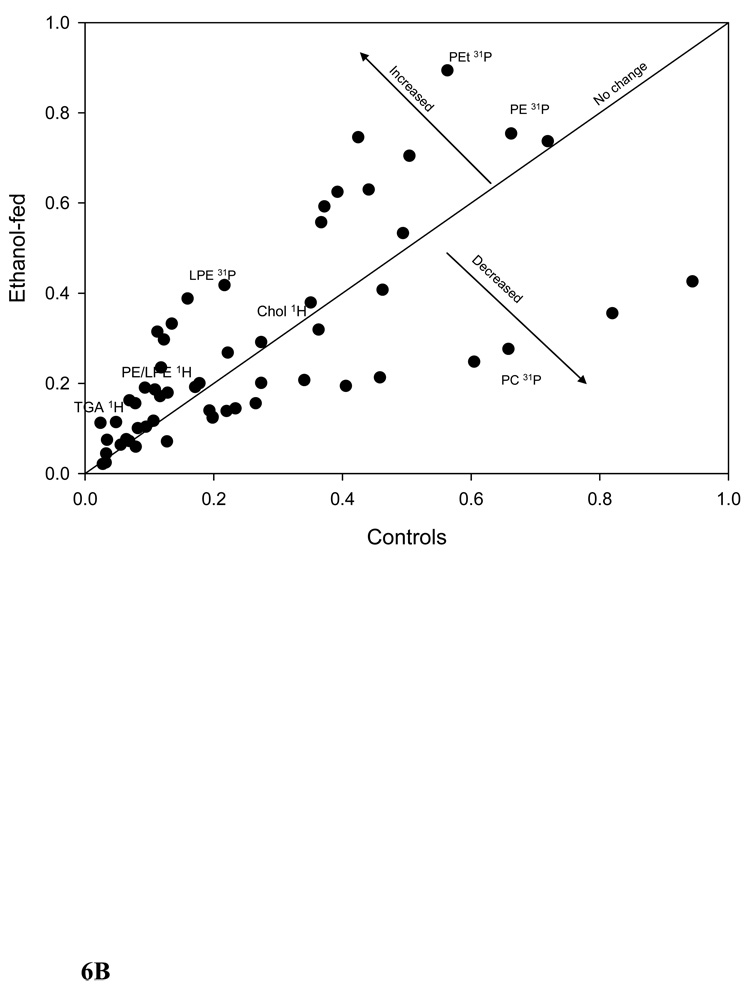
Results: Hematoxylin and Eosin and Oil Red O stained liver sections showed significant fatty infiltration. Immunohistochemical analysis of liver sections from ethanol-fed rats showed no inflammation (absence of CD3 positive cells) or oxidative stress (absence of malondialdehyde reactivity or 4-hydroxynonenal positive staining). Cluster analysis and principal component analysis of ¹H NMR data of lipid extracts of both plasma and livers showed a significant difference in the lipid metabolome of ethanol-fed versus control rats. ³¹P NMR data of liver lipid extracts showed significant changes in phospholipids similar to ¹H NMR data. ¹H NMR data of plasma and liver reflected several changes, while comparison of ¹H NMR and ³¹P NMR data offered a correlation among the phospholipids.

Conclusions: Our results show that alcohol consumption alters metabolism of cholesterol, triglycerides, and phospholipids that could contribute to the development of fatty liver. These studies also indicate that fatty liver precedes oxidative stress and inflammation. The similarities observed in plasma and liver lipid profiles offer a potential methodology for detecting early-stage alcohol-induced fatty liver disease by analyzing the plasma lipid profile.


Figures

Figure 1
Figure 1
Histology and immunohistochemistry of livers of pair-fed control Fischer 344 rats vs. those fed 5% ethanol in liquid diet for one month. The upper panel shows H&E stained liver sections from (a) control with normal histology and no lipid deposition. (b) Ethanol-fed liver shows vacuolization consistent with significant fat deposition (arrows). In the second panel, Oil Red O stained liver sections for (c) control and (d) ethanol-fed, show increased positive staining for fat vacuoles in liver section of ethanol-fed group. The third panel shows CD3 stained liver sections from (e) the control and (f) ethanol-fed showing a similar lack of staining for CD3 positive cells in portal area or blood vessels. The last panel shows negative staining for antibodies against 4-HNE in liver sections from (g) control and (h) ethanol-fed groups, indicative of a lack of significant oxidative stress. All photomicrographs are at the same power (×200).
Figure 2
Figure 2
Representative superimposed one dimensional 1H NMR spectra (750 MHz for plasma and 800 MHz for liver) of lipid extracts from plasma (A) and liver (B) of control and ethanol-fed rats between −0.2 to7.6 ppm. TMS = 0.0 ppm Control (black) and ethanol-fed (blue). The numbers in the figures represent the positions at which the changes in NMR chemical shifts were observed and are listed in Tables 1 and 2.
Figure 3
Figure 3
PCA of the 1H NMR spectra from plasma (A) and liver (B) lipid extracts at p ≤ 0.01. The three dimensional plot of the data demonstrates separation of ethanol-fed rats from controls. C1–C6 represents control rats (green) and E1–E7 represents ethanol-fed rats (red). In PCA each point represents a value calculated from an individual spectrum. One cluster consists of ethanol-fed group while the other cluster consists of six control rats and two ethanol-fed rats. Heat maps generated for plasma and liver lipids by HC are available in the supplementary material.
Figure 3
Figure 3
PCA of the 1H NMR spectra from plasma (A) and liver (B) lipid extracts at p ≤ 0.01. The three dimensional plot of the data demonstrates separation of ethanol-fed rats from controls. C1–C6 represents control rats (green) and E1–E7 represents ethanol-fed rats (red). In PCA each point represents a value calculated from an individual spectrum. One cluster consists of ethanol-fed group while the other cluster consists of six control rats and two ethanol-fed rats. Heat maps generated for plasma and liver lipids by HC are available in the supplementary material.
Figure 4
Figure 4
(A) 31P NMR spectra of liver extracts from control and ethanol-fed rats between −0.2 to 2.6 ppm. The spectra were recorded using a 600 MHz NMR spectrophotometer and TEP as an internal standard. The peak assignments of identified metabolites are as follows: 1. Phosphatidylethanol, 2. Phosphatidylcholine, 3. Lyso-phosphatidylcholine, 4. Sphingomyelin, 5. Phosphatidylserine, 6. Phosphatidylethanolamine, and 7. Lysophosphatidylethanolamine. (B)Three dimensional PCA plot of the data demonstrates separation of ethanol-fed (E1–E7, red) and control (C1–C6, green) rats.
Figure 4
Figure 4
(A) 31P NMR spectra of liver extracts from control and ethanol-fed rats between −0.2 to 2.6 ppm. The spectra were recorded using a 600 MHz NMR spectrophotometer and TEP as an internal standard. The peak assignments of identified metabolites are as follows: 1. Phosphatidylethanol, 2. Phosphatidylcholine, 3. Lyso-phosphatidylcholine, 4. Sphingomyelin, 5. Phosphatidylserine, 6. Phosphatidylethanolamine, and 7. Lysophosphatidylethanolamine. (B)Three dimensional PCA plot of the data demonstrates separation of ethanol-fed (E1–E7, red) and control (C1–C6, green) rats.
Figure 5
Figure 5
PCA score plots of lipid data. (A) Combined 1H NMR data of plasma and liver lipids. (B) Combined 1H NMR and 31P NMR of liver lipid extracts. (C) Combined 1H NMR of plasma/liver lipid extracts and 31P NMR of liver lipid extracts. PCA were performed by taking the values from each type of data with p ≤ 0.005. The three-dimensional plots of the data demonstrate clear separation of ethanol-fed rats. C1–C6 represents control rats and E1–E7 represents ethanol-fed rats. In PCA, each point represents a value calculated from an individual spectrum and green and red squares represent control and ethanol-fed animals, respectively. Heat maps generated for each combination by HC are available in the supplementary material.
Figure 5
Figure 5
PCA score plots of lipid data. (A) Combined 1H NMR data of plasma and liver lipids. (B) Combined 1H NMR and 31P NMR of liver lipid extracts. (C) Combined 1H NMR of plasma/liver lipid extracts and 31P NMR of liver lipid extracts. PCA were performed by taking the values from each type of data with p ≤ 0.005. The three-dimensional plots of the data demonstrate clear separation of ethanol-fed rats. C1–C6 represents control rats and E1–E7 represents ethanol-fed rats. In PCA, each point represents a value calculated from an individual spectrum and green and red squares represent control and ethanol-fed animals, respectively. Heat maps generated for each combination by HC are available in the supplementary material.
Figure 6
Figure 6
The plots of controls vs. ethanol-fed NMR data. (A) 1H NMR data of plasma and liver. Arrows indicate increased or decreased bin integration values corresponding to different lipid metabolites. One metabolite may have more than one point and all the points are not marked. The plot was made by taking the average bin integration values of control and ethanol-fed group at p ≤ 0.05 (P-plasma, L-liver) and the changes corresponding to all the fatty acyl chains are not included in the figure. (B) 1H and 31P NMR data of liver.
Figure 6
Figure 6
The plots of controls vs. ethanol-fed NMR data. (A) 1H NMR data of plasma and liver. Arrows indicate increased or decreased bin integration values corresponding to different lipid metabolites. One metabolite may have more than one point and all the points are not marked. The plot was made by taking the average bin integration values of control and ethanol-fed group at p ≤ 0.05 (P-plasma, L-liver) and the changes corresponding to all the fatty acyl chains are not included in the figure. (B) 1H and 31P NMR data of liver.

References

    1. Akamatsu Y, Law JH. The enzymatic synthesis of fatty acid methyl esters by carboxyl group alkylation. J Biol Chem. 1970;245:709–713. - PubMed
    1. Apte UM, Banerjee A, McRee R, Wellberg E, Ramaiah SK. Role of osteopontin in hepatic neutrophil infiltration during alcoholic steatohepatitis. Toxicol Appl Pharmacol. 2005;207:25–38. - PubMed
    1. Awl RA, Frankel EN, Weisleder D. Synthesis and Characterization of Triacylglycerols Containing Linoleate and Linolenate. Lipids. 1989;24:866–872. - PubMed
    1. Barak AJ, Beckenhauer HC, Tuma DJ, Badakhsh S. Effects of prolonged ethanol feeding on methionine metabolism in rat liver. Biochem Cell Biol. 1987;65:230–233. - PubMed
    1. Beckonert O, Keun HC, Ebbels TM, Bundy J, Holmes E, Lindon JC, Nicholson JK. Metabolic profiling, metabolomic and metabonomic procedures for NMR spectroscopy of urine, plasma, serum and tissue extracts. Nat Protoc. 2007;2:2692–2703. - PubMed

Publication types

MeSH terms